Gold slips as oil and silver edge higher
Gold fell on Tuesday while silver and the main crude benchmarks posted gains, leaving the complex mixed. Copper led the day’s advances, and the spread between the strongest and weakest moves was wide.
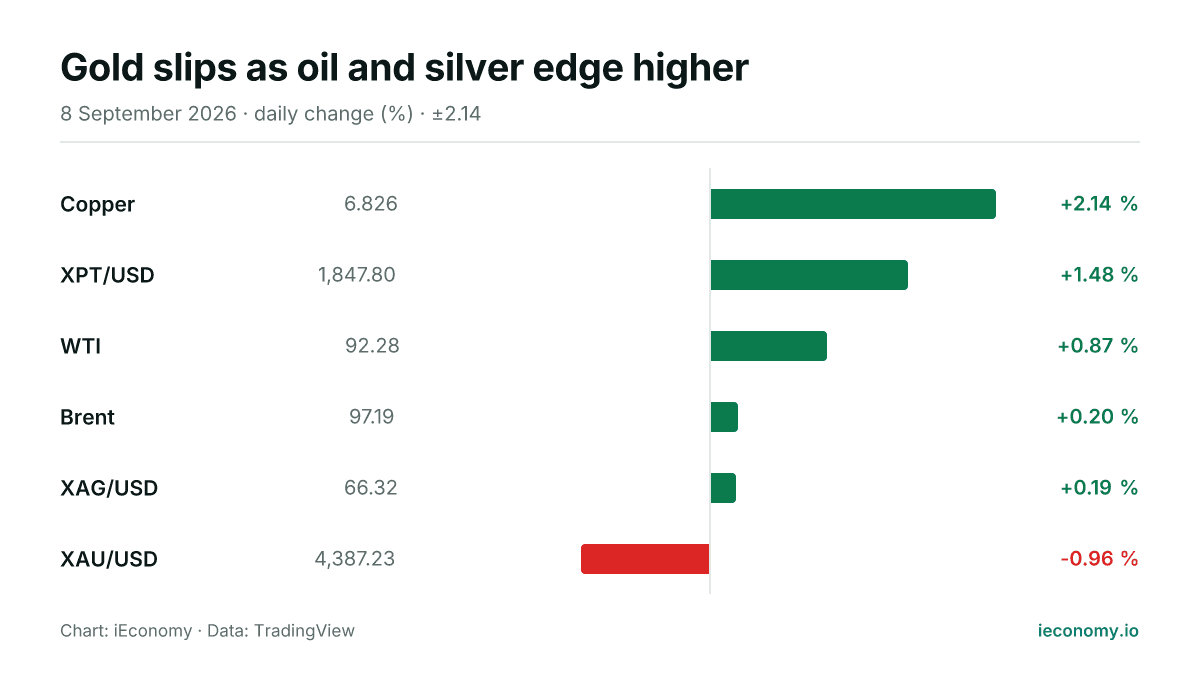
Chart: iEconomy · Data: TradingView
Commodities were mixed on Tuesday, with five of six tracked contracts higher and gold the only loser. Copper led the board, while crude oil rose more modestly and silver barely moved in positive territory.
What moved and by how much
XAU/USD fell 0.96%, the sharpest move in the group and the only decline in the digest. By contrast, XAG/USD added 0.19%, showing a far smaller change and leaving precious metals split.
| Instrument | Last | Change |
|---|---|---|
| Copper | 6.826 | +2.14 % |
| XPT/USD | 1,847.80 | +1.48 % |
| WTI | 92.28 | +0.87 % |
| Brent | 97.19 | +0.20 % |
| XAG/USD | 66.32 | +0.19 % |
| XAU/USD | 4,387.23 | -0.96 % |
Among energy contracts, WTI gained 0.87% and Brent rose 0.20%. The gap between the two reflects different benchmark dynamics, with the larger percentage move in WTI showing stronger day-to-day sensitivity than Brent on this session.
Copper climbed 2.14% and was the standout advance across the wider complex. XPT/USD also gained 1.48%, placing platinum-group metals ahead of silver and crude in percentage terms.
The standouts at each end
The strongest move came from copper, which rose more than any other tracked instrument. That matters mechanically because when a market moves by more than 2% in a single day, it tends to dominate attention even if the broader complex is otherwise balanced.
At the other end, gold was the only lower instrument and also one of the most heavily watched. A decline in the flagship precious metal can matter for sentiment because it sits near the centre of the complex and often anchors comparisons across related contracts.
The day’s range from copper’s gain to gold’s drop was wide enough to show that the metals and energy groups did not move in lockstep. For readers, that is a reminder that each contract still trades on its own order flow even when the broader asset class looks coherent.
What a long-term investor should take from one day
One session does not alter the long-term case for any commodity on its own. The practical lesson is that short-dated moves can be driven by positioning, liquidity and benchmark-specific trading, so single-day performance can look dramatic without changing the underlying structure of the market.
For investors with longer horizons, the useful signal is dispersion rather than direction. When copper, silver, platinum and oil are all positive while gold is lower, it shows how quickly relative performance can shift within the same broad universe.
That is why a one-day report should be read as a snapshot, not a verdict. Price changes of this size can affect mark-to-market risk immediately, but they do not by themselves establish a trend or resolve how the next session will trade.
This article is not investment advice and recommends no asset, level or direction; a single session's move is not evidence of a trend. For background see Markets, Bear Market, BIST 100, and for terms the finance glossary.
Frequently asked questions
Which instrument moved the most on Tuesday?
Copper moved the most, rising 2.14%. It was the strongest performer in the digest and the clearest outlier on the day.
Did gold and silver move in the same direction?
No. Gold fell 0.96% while silver edged up 0.19%. That divergence shows that the precious-metals complex can split even within one session.
What should readers remember about the crude oil moves?
WTI and Brent both rose, but by different amounts: WTI gained 0.87% and Brent 0.20%. The difference underlines that the two benchmarks can trade with similar direction but different intensity.
Sources
Related News
Gold and silver slip as crude edges higher
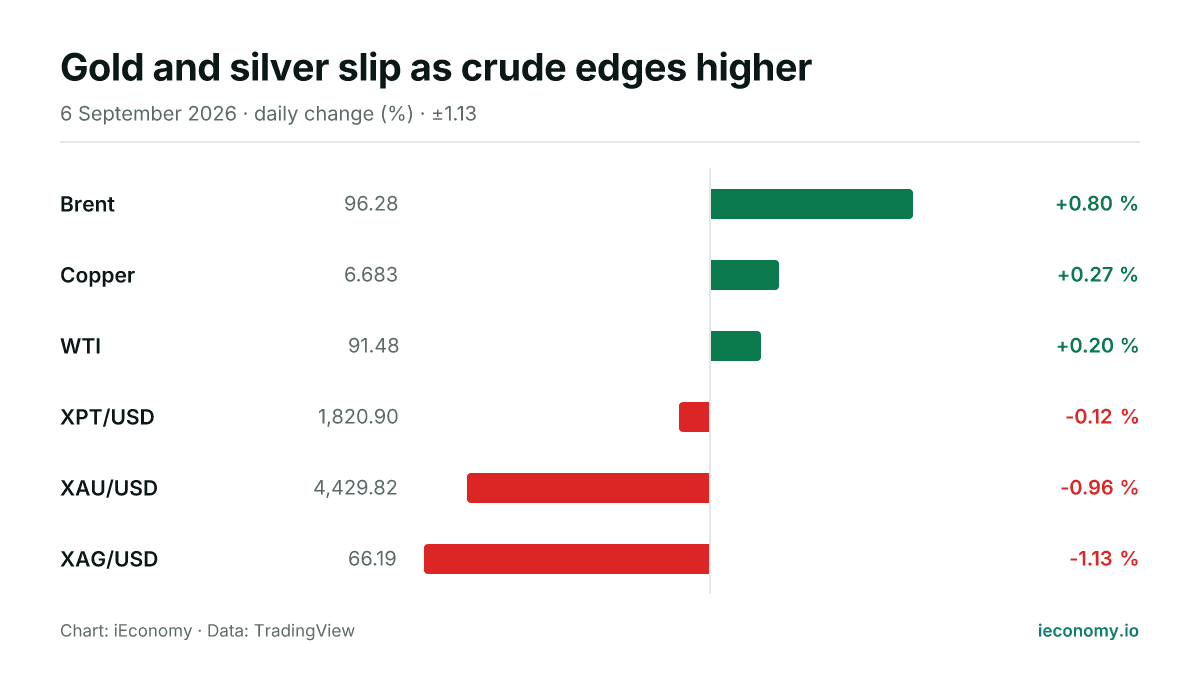
Gold and silver were weaker on Sunday while Brent and WTI posted gains. The session showed a broad split across the metals and oil complex, with one-day moves that matter for positioning but not for long-term conclusions.
Gold and silver slide as crude edges higher
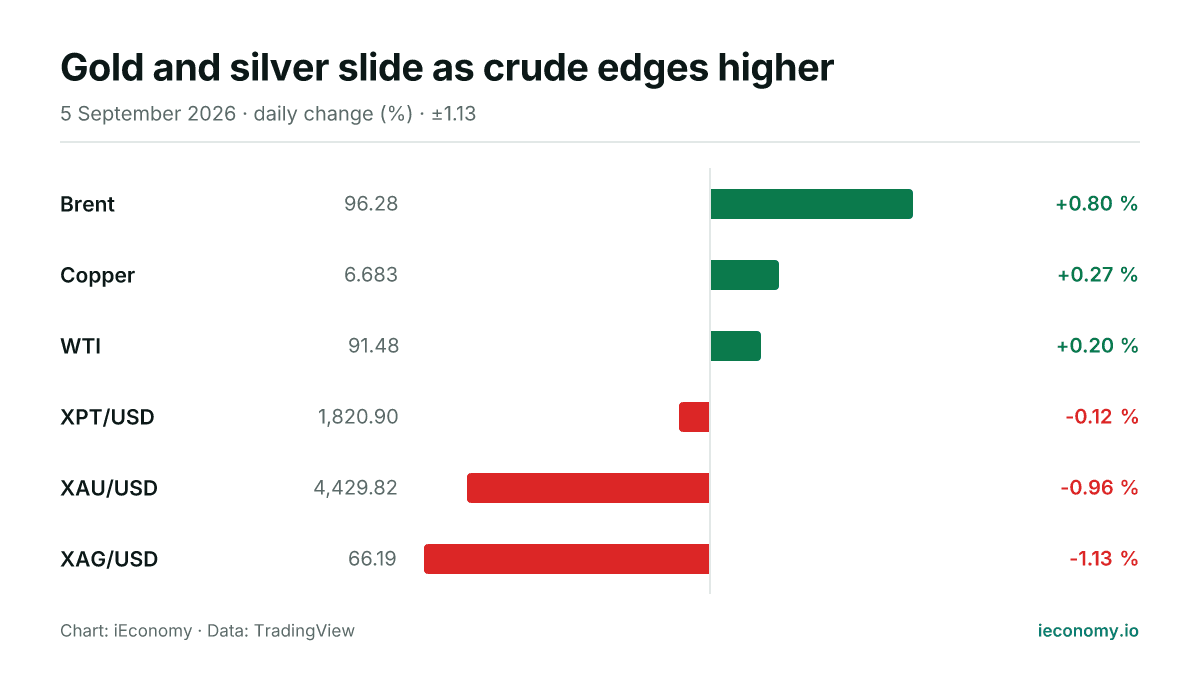
Gold and silver weakened on Saturday while Brent and WTI moved higher, leaving the complex mixed across six tracked contracts. The day’s moves were modest in crude and sharper in precious metals, with risk still tied to intraday trading conditions.
Oil jumps while gold and silver fall on the day
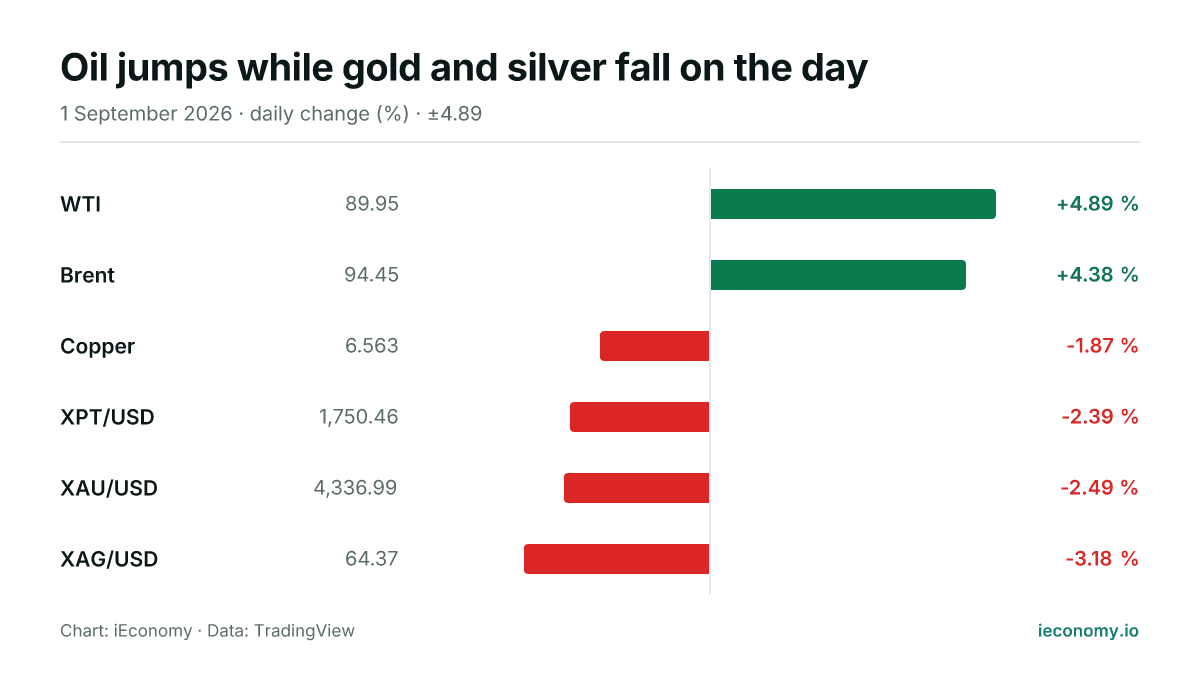
Crude oil rose sharply on Tuesday, while gold and silver retreated and copper also eased. The move left only two of six tracked commodities higher, underscoring a broad split in the day’s price action.
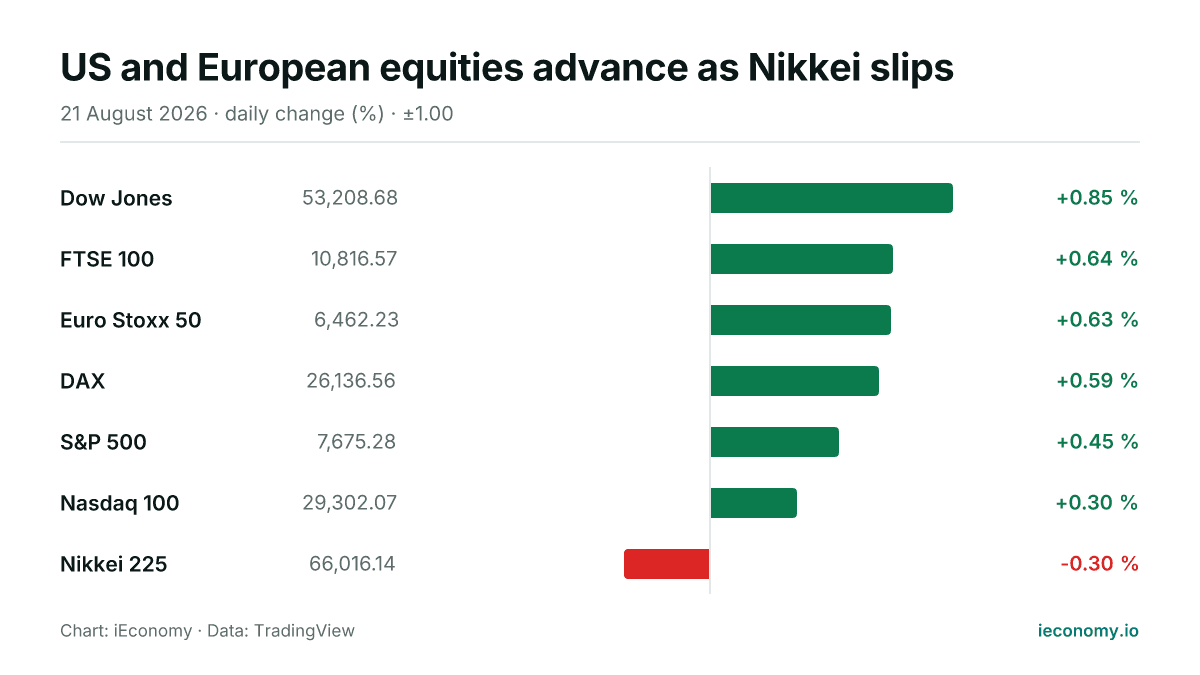
US and European equities advance as Nikkei slips
World equity markets were mostly firmer on Friday, with US and European benchmarks higher and Japan's Nikkei 225 lower. The moves were broad but modest, leaving risk appetite positive without being one-directional.
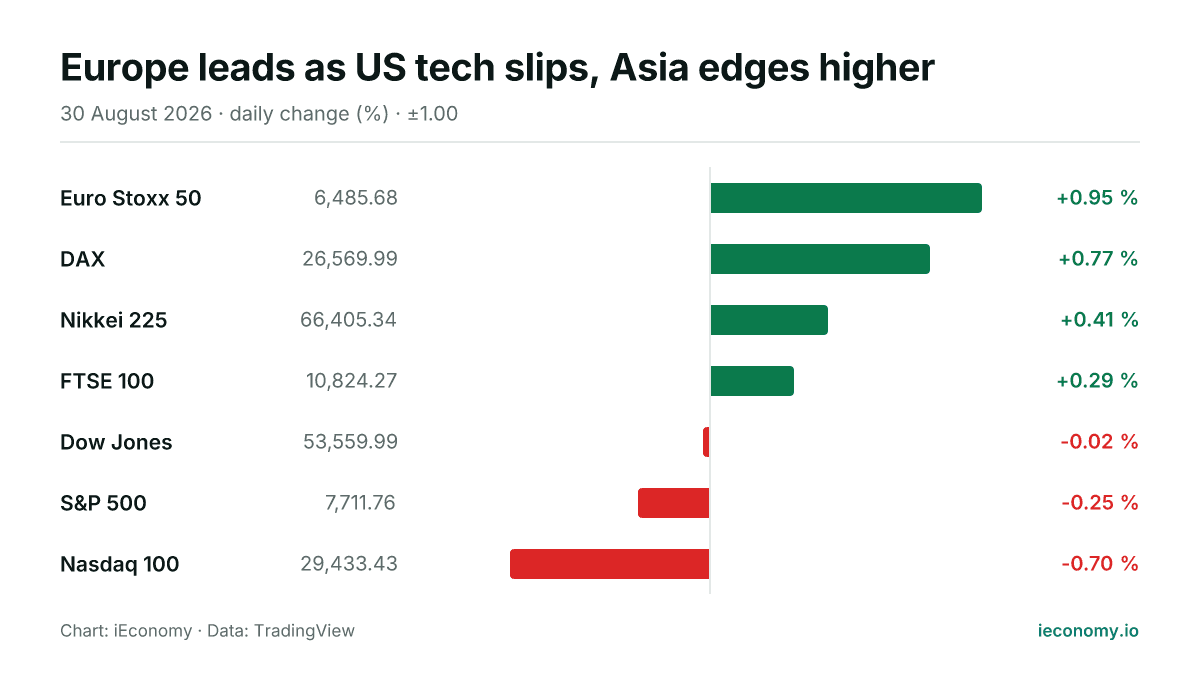
Europe leads as US tech slips, Asia edges higher
European benchmarks outperformed on Sunday, while Asian equities were firmer and the main US averages finished lower. The day’s moves were modest in some cases, but the spread between winners and laggards was clear.
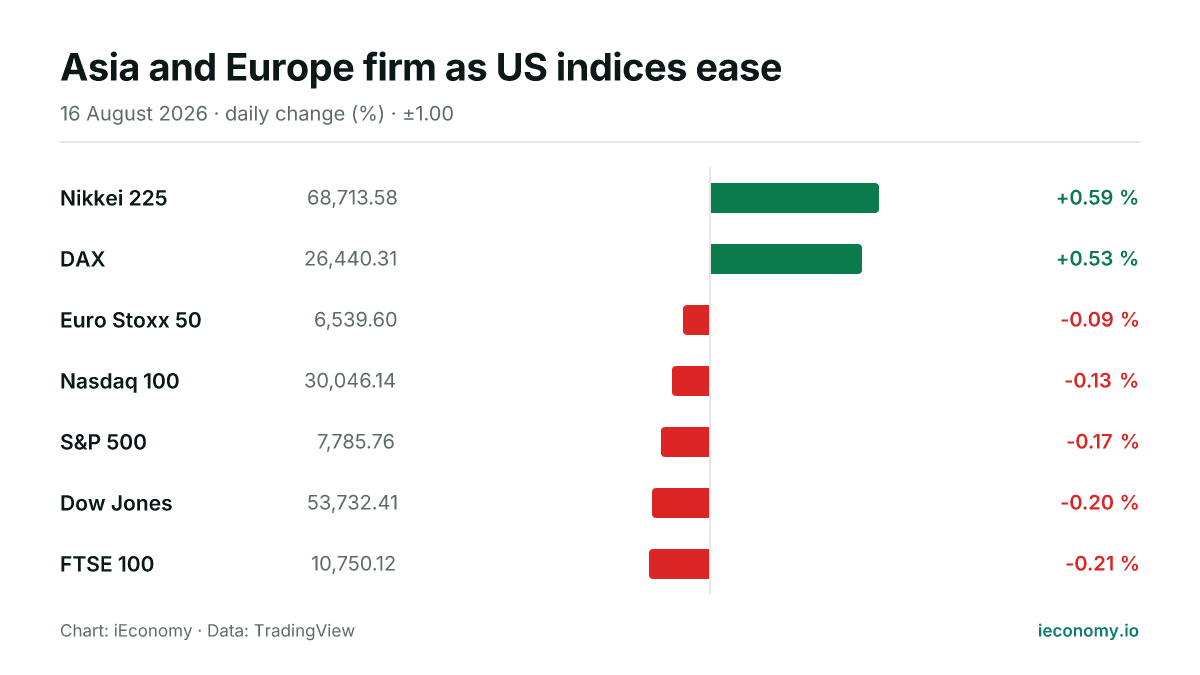
Asia and Europe firm as US indices ease
Japanese and German equities led a mixed global session, while US benchmarks slipped modestly. The day left seven tracked markets split between small gains and broad-but-shallow declines.