S&P 500 Consolidates at Elevated Levels Amid Macro Crosscurrents
The benchmark equity index trades near 7,440, showing modest year-to-date gains but muted recent momentum. With the RSI in neutral territory, the market appears to be digesting its significant run-up while awaiting clearer signals on growth and policy.
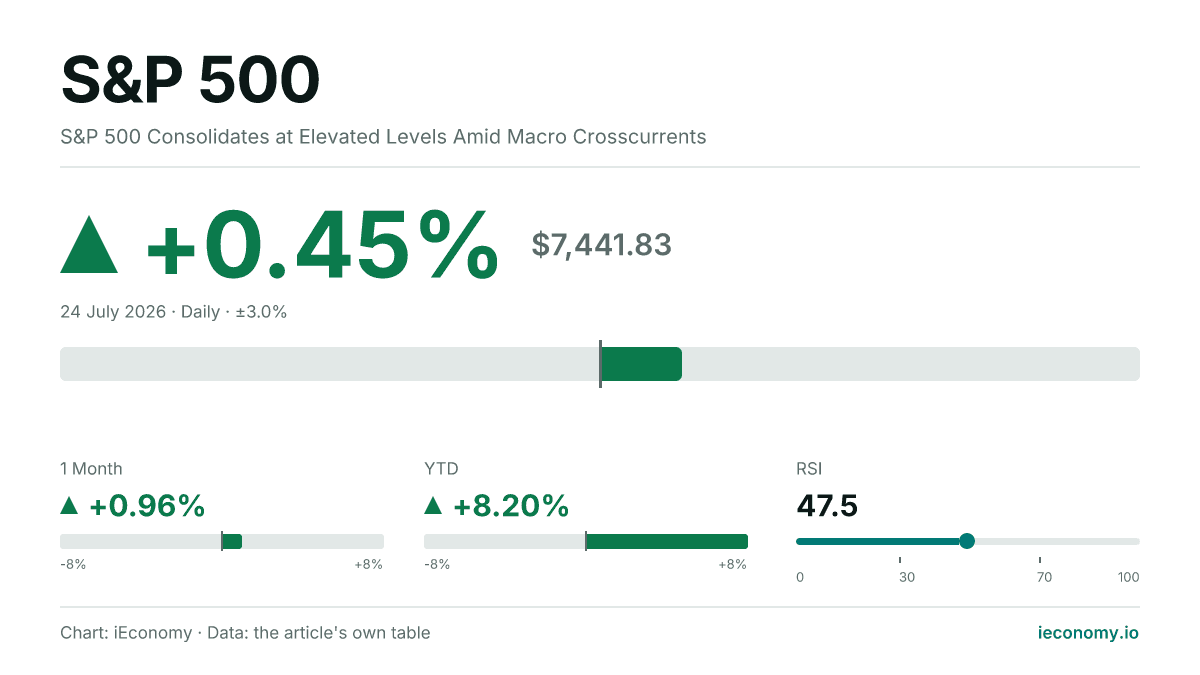
Chart: iEconomy · Data: the article's own table
The S&P 500, trading at 7,441.83, finds itself in a period of consolidation after a robust start to the year. The index's year-to-date performance of +8.20% underscores a persistent, though recently moderated, bullish trend.
However, the daily gain of +0.45% and the one-month performance of +0.96% suggest a significant deceleration in momentum, indicating a market in search of a new catalyst.
The current Relative Strength Index (RSI) reading of 47.5 places the index squarely in neutral technical territory, neither overbought nor oversold, which often precedes a period of range-bound trading or a decisive directional move.
| Indicator | Value |
|---|---|
| Last price (USD) | 7,441.83 |
| Daily | +0.45% |
| 1 Month | +0.96% |
| YTD | +8.20% |
| RSI (14) | 47.5 |
Macroeconomic and Sectoral Drivers
The primary narrative for U.S. equities in 2026 remains the interplay between corporate earnings resilience and the Federal Reserve's policy path. The index's year-to-date advance suggests the market has been pricing in a 'soft landing' scenario, where growth moderates without tipping into a severe downturn.
However, the recent flattening of the one-month performance hints at increasing investor caution. This could be attributed to renewed scrutiny of valuation levels at these historic price points or to data suggesting a potential reacceleration of inflation that might delay or reverse anticipated monetary easing.
Sector rotation has likely been a key feature, with leadership potentially shifting between technology, healthcare, and industrials as the economic outlook evolves.
Technical Picture and Market Structure
Technically, the S&P 500's posture is one of high-level equilibrium. The RSI reading of 47.5 is indicative of balanced buying and selling pressure, with no immediate overextension in either direction.
Historically, an RSI hovering around the mid-40s to low-50s can precede either a continuation of the prevailing trend or a period of consolidation.
The +8.20% YTD gain establishes a clear intermediate-term uptrend, but the sharp slowdown in the one-month performance to under 1% suggests the trend's momentum is waning.
This creates a technical setup where a break above recent resistance could reignite the bullish trend, while a failure to hold support could trigger a deeper corrective phase. The market structure appears to be testing the sustainability of its current valuation plateau.
Fundamental and Structural Context
Fundamentally, the S&P 500's level near 7,440 reflects a market that has fully absorbed and priced in a significant amount of positive news. Earnings growth expectations for 2026 will be critical; any material downgrades could challenge current valuations.
Structurally, the index continues to be influenced by the outsized weight of mega-cap technology and communication services companies, whose fortunes are tied to cyclical demand, regulatory developments, and continued innovation in artificial intelligence and automation.
The performance dispersion between these market leaders and the broader constituents will be a key determinant of index trajectory. The current price level implies high investor confidence in long-term corporate profitability, but also leaves little room for disappointment.
Conditional Forward Scenarios
The path forward from here is highly conditional on incoming data and policy developments.
In a bullish scenario, a renewed decline in inflation metrics coupled with stable employment data could reinforce expectations for a dovish policy pivot, potentially providing the catalyst for the index to break out from its consolidation and extend its YTD gains.
Technically, this would be confirmed by the RSI moving decisively above 50 with increasing price momentum. In a base-case scenario, the current equilibrium persists, characterized by choppy, range-bound trading as the market awaits more concrete evidence on the economic trajectory.
This would see the index oscillating around current levels with the RSI fluctuating neutrally. A bearish scenario would be triggered by signs of economic overheating leading to a more hawkish Fed stance, or by a sharp deterioration in corporate profit margins.
This could lead to a technical breakdown, with the RSI falling into oversold territory (below 30) and the index relinquishing a portion of its YTD gains.
Key Risks and Monitoring Points
The principal risks are skewed towards policy error and growth disappointment. An abrupt shift in the Federal Reserve's communication towards maintaining higher-for-longer rates, or even tightening, poses a significant threat to equity valuations.
Conversely, evidence of a sharper-than-expected economic slowdown would challenge the earnings outlook embedded in current prices. From a technical standpoint, a sustained move in the RSI below 40 would signal increasing selling pressure and a potential trend change.
Investors should monitor upcoming inflation prints, labor market reports, and the tone of Fed commentary for directional cues. Additionally, the breadth of market participation—whether advances are led by a narrow cohort or are broad-based—will be crucial for assessing the health of the underlying uptrend.
The convergence or divergence of these fundamental and technical signals will dictate the next major phase for the index.
Sources
Related News

Oil Prices Rise as Strikes Stir Strait of Hormuz Risk
Crude futures advanced after fresh U.S.-Iran attacks and Tehran’s warning of a new restricted zone near the Strait of Hormuz heightened concern over Middle East supply flows.
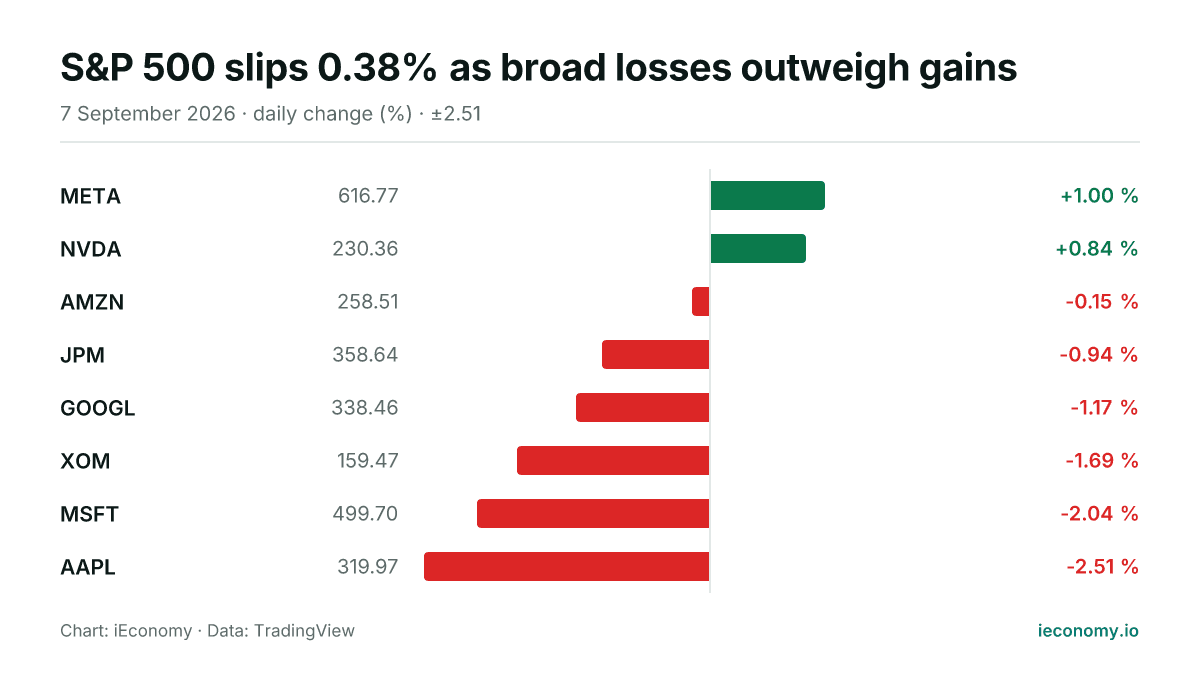
S&P 500 slips 0.38% as broad losses outweigh gains
The S&P 500 edged lower on Monday, ending at 7,718.60. Among the eight tracked constituents, two rose and six fell, with META the strongest and AAPL the weakest.
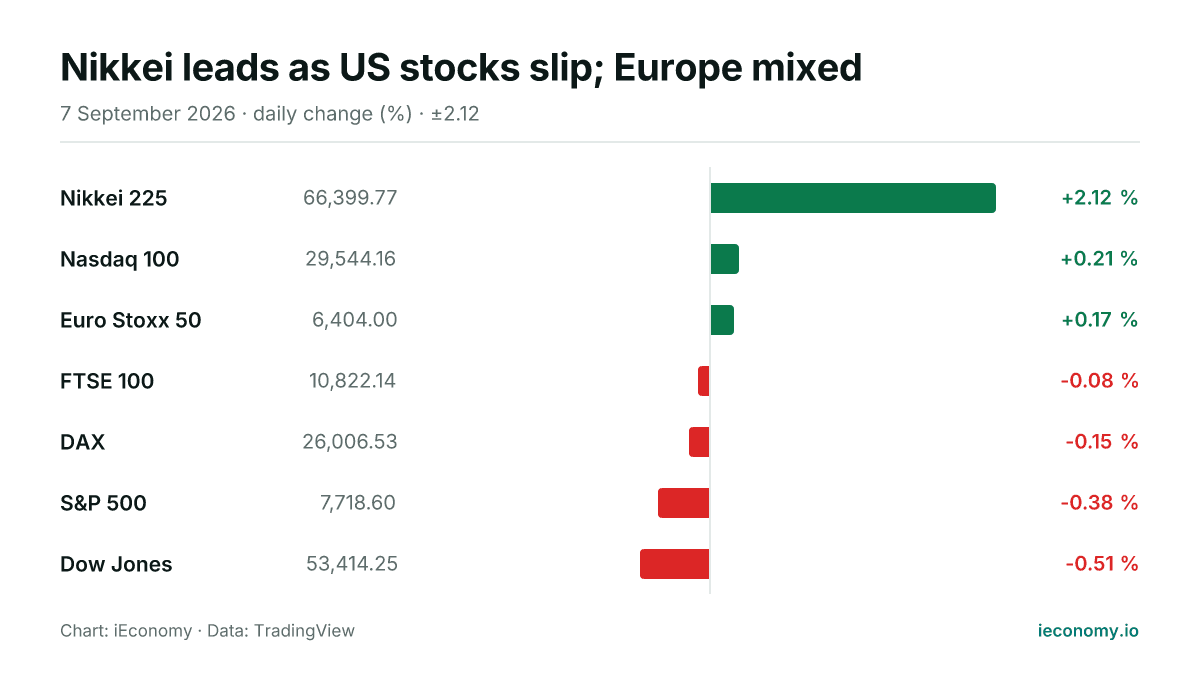
Nikkei leads as US stocks slip; Europe mixed
Asian equities outperformed on Monday, with the Nikkei 225 rising sharply while US benchmarks traded lower and Europe was mixed. The day’s moves were modest in most markets, but the gap between Japan and Wall Street stood out.
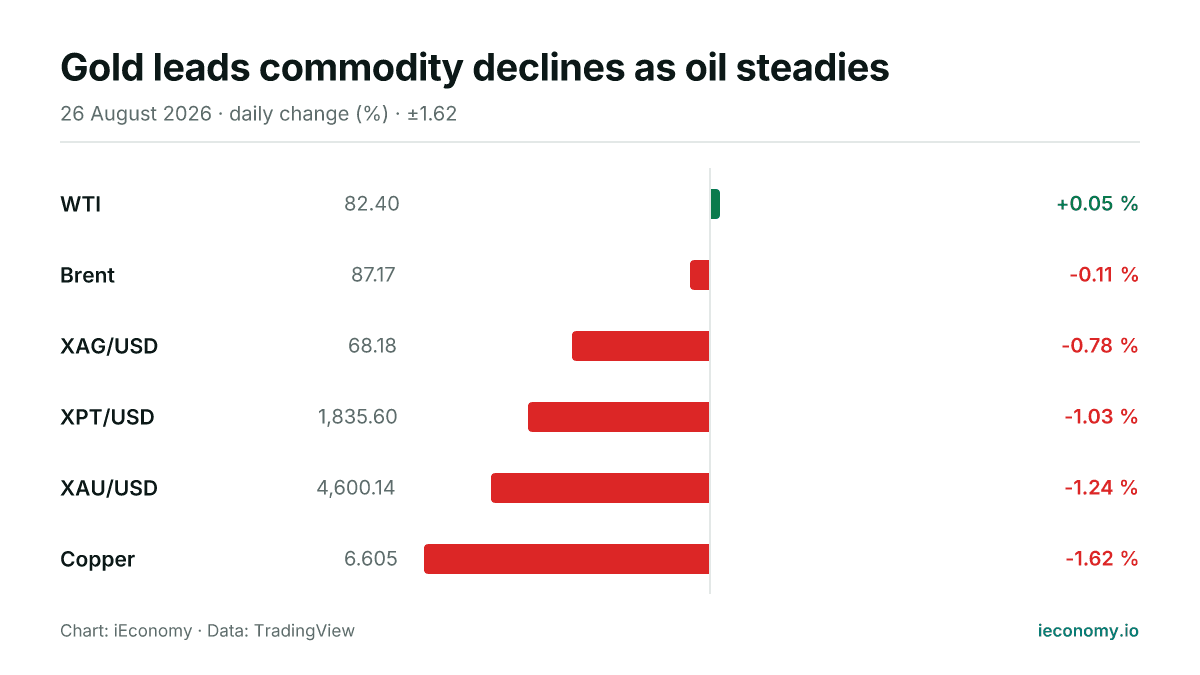
Gold leads commodity declines as oil steadies
On Wednesday, most tracked commodities were lower, with gold and silver among the weakest. WTI was the only gain in the six-instrument set, while Brent also edged down.
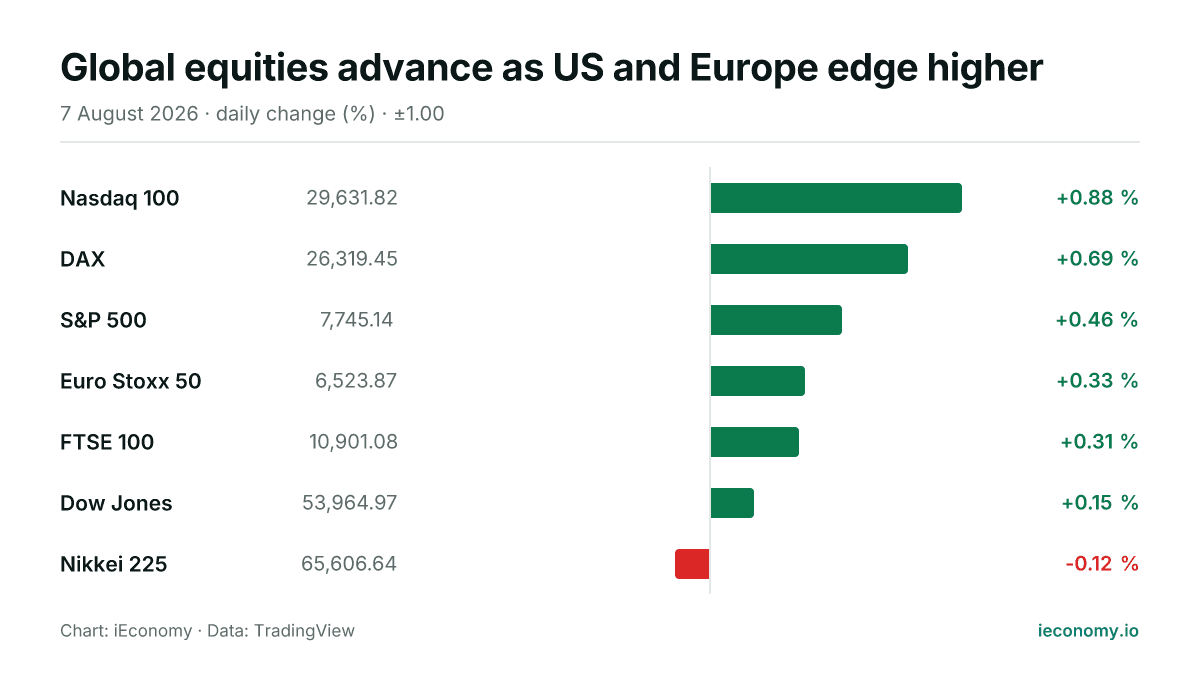
Global equities advance as US and Europe edge higher
Most major equity benchmarks rose on Friday, led by the Nasdaq 100, while Japan’s Nikkei 225 slipped. The day’s moves were modest overall, with breadth still favouring gains across the tracked indices.
Oil heads for weekly loss as Hormuz supply outlook improves
Oil prices were subdued on Friday and headed for a weekly loss as signs of more crude moving through the Strait of Hormuz eased supply fears, even as diplomacy remained uncertain.