S&P 500 slips 0.38% as broad losses outweigh gains
The S&P 500 edged lower on Monday, ending at 7,718.60. Among the eight tracked constituents, two rose and six fell, with META the strongest and AAPL the weakest.
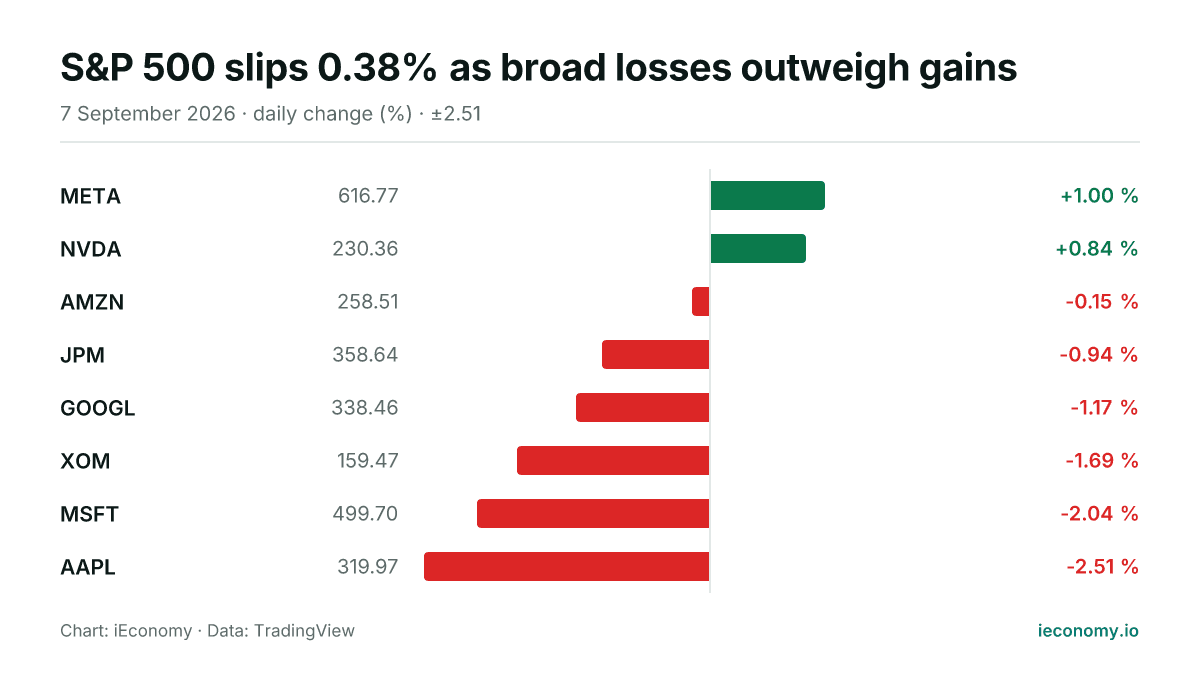
Chart: iEconomy · Data: TradingView
The S&P 500 finished Monday at 7,718.60, down 0.38% on the day. The decline was modest, but it was broad enough to leave a negative tone across the index, with six of the eight tracked constituents closing lower.
Index move and breadth
The session pointed to limited but clear downside pressure rather than a sharp sell-off. With only two names higher against six lower, breadth was tilted against the index and the losses were not confined to a single stock.
For readers, the key mechanic is that an index can edge down even when a few large names hold up. When more constituents weaken than strengthen, the aggregate effect usually drags on the benchmark unless the winners are strong enough to offset it.
| Stock | Last | Change |
|---|---|---|
| META | 616.77 | +1.00 % |
| NVDA | 230.36 | +0.84 % |
| AMZN | 258.51 | -0.15 % |
| JPM | 358.64 | -0.94 % |
| GOOGL | 338.46 | -1.17 % |
| XOM | 159.47 | -1.69 % |
| MSFT | 499.70 | -2.04 % |
| AAPL | 319.97 | -2.51 % |
Standout individual performers
META was the best performer among the tracked names, rising 1.00% to 616.77. That gain was enough to stand out on an otherwise softer day, but it did not prevent the wider index from closing in the red.
AAPL was the weakest performer, falling 2.51% to 319.97. A move of that size in a prominent constituent can weigh on sentiment and on the index’s daily balance, especially when the rest of the group is also broadly weaker.
What a long-term investor should take from it
One session rarely changes the longer-term picture on its own. Daily moves mainly show how prices are being repriced in the moment, and they can be driven by portfolio rebalancing, positioning, or simple supply and demand rather than any durable shift in fundamentals.
The more useful takeaway is mechanical: breadth matters, but so does context. A modest decline with mixed leadership is part of normal market behaviour, and long-term investors usually treat it as one data point rather than a conclusion.
Sources
Related News
Nikkei leads as US stocks slip; Europe mixed
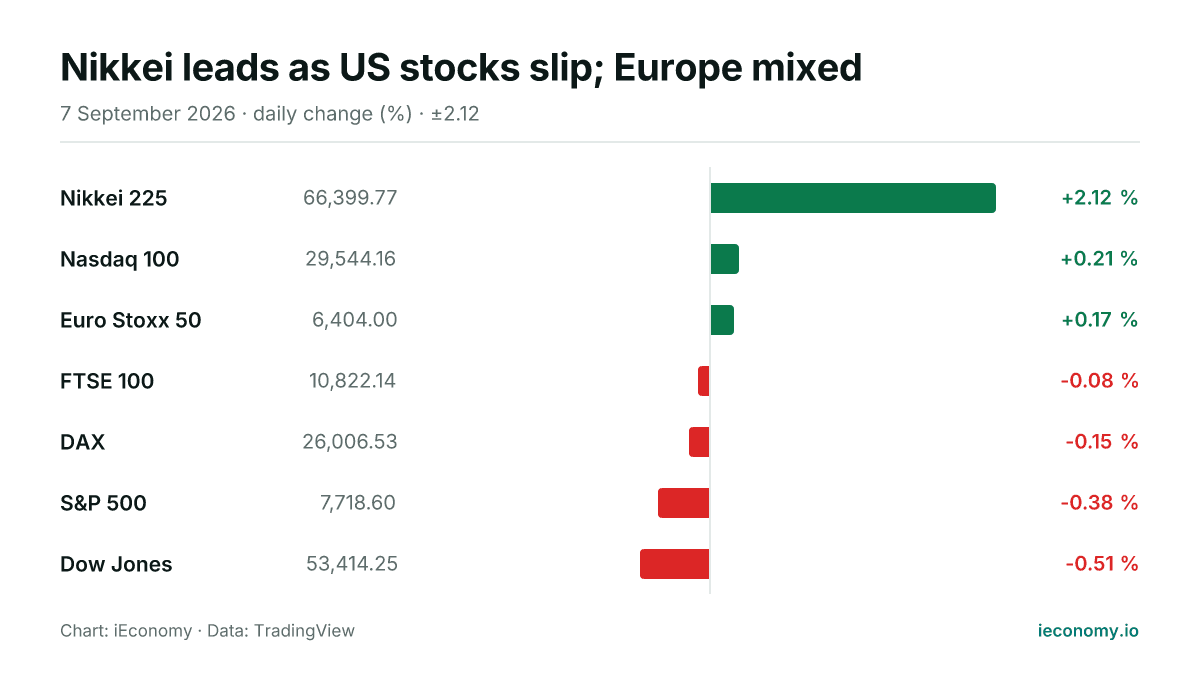
Asian equities outperformed on Monday, with the Nikkei 225 rising sharply while US benchmarks traded lower and Europe was mixed. The day’s moves were modest in most markets, but the gap between Japan and Wall Street stood out.
Gold and silver slip as crude edges higher
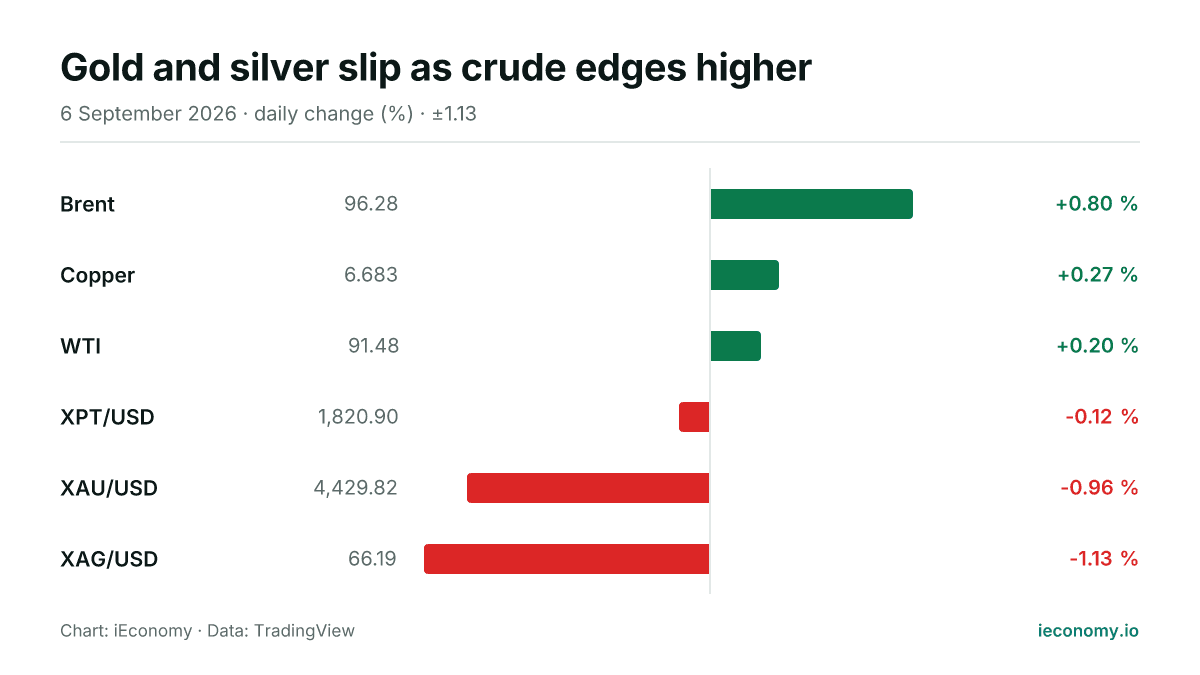
Gold and silver were weaker on Sunday while Brent and WTI posted gains. The session showed a broad split across the metals and oil complex, with one-day moves that matter for positioning but not for long-term conclusions.
Gold and silver slide as crude edges higher
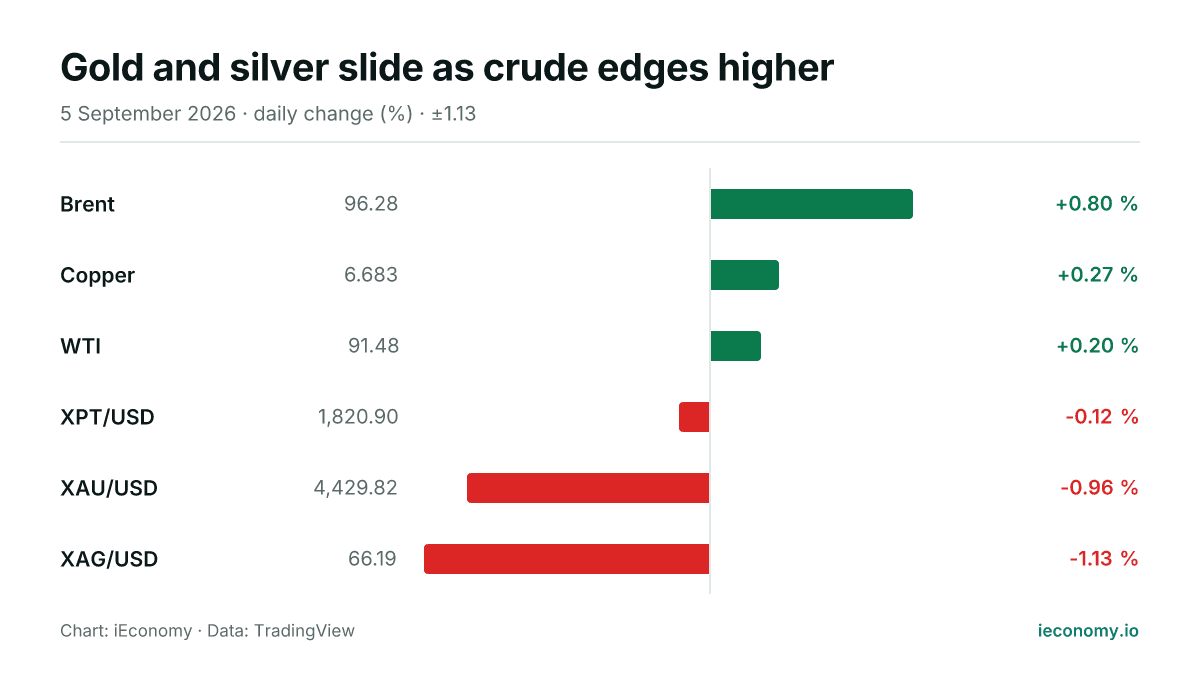
Gold and silver weakened on Saturday while Brent and WTI moved higher, leaving the complex mixed across six tracked contracts. The day’s moves were modest in crude and sharper in precious metals, with risk still tied to intraday trading conditions.
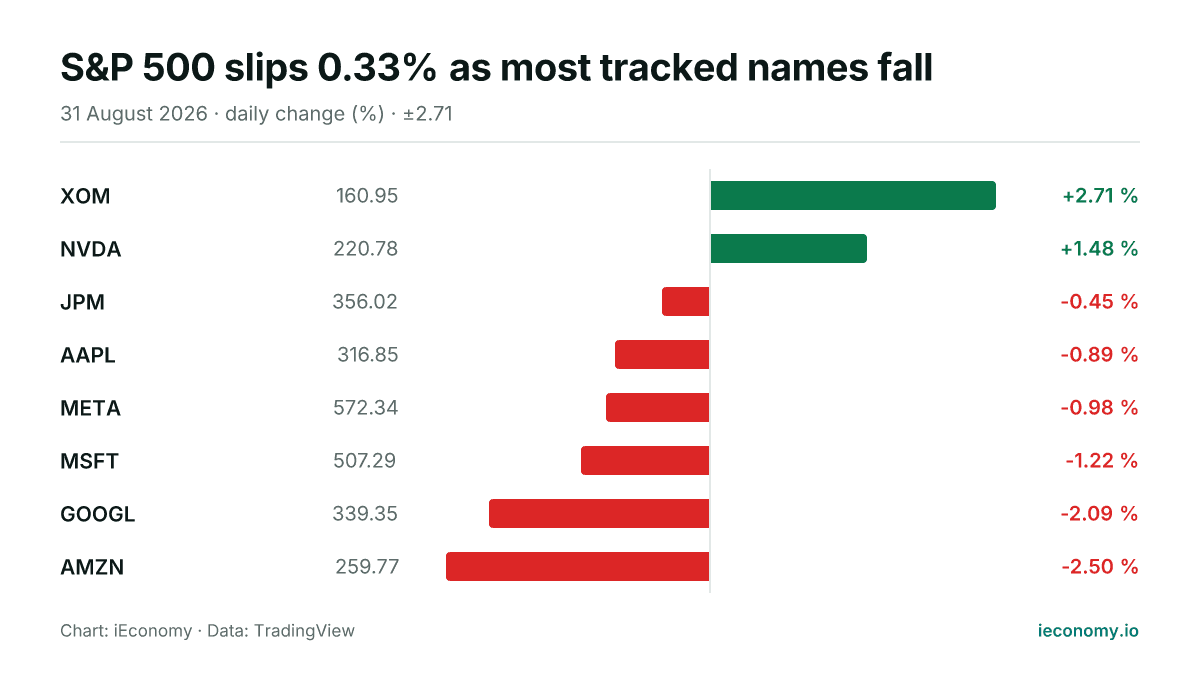
S&P 500 slips 0.33% as most tracked names fall
The S&P 500 ended Monday at 7,686.14, down 0.33% on the session. In the small set of tracked constituents, six fell and two rose, with Exxon Mobil the strongest and Amazon the weakest.
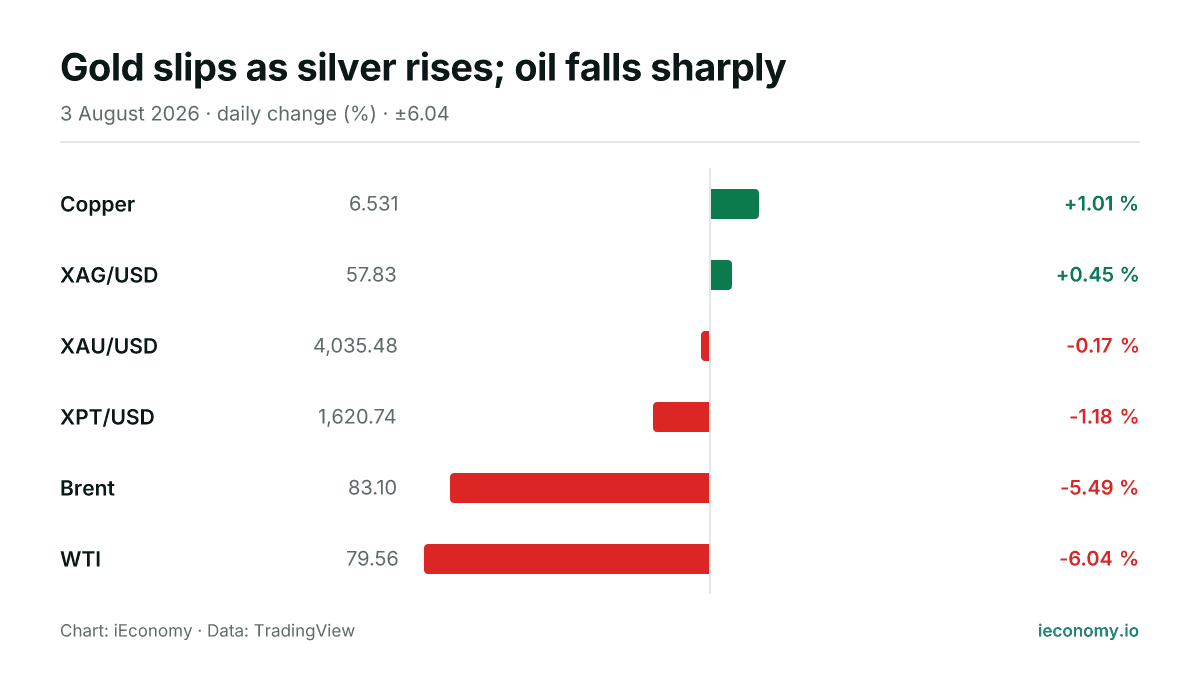
Gold slips as silver rises; oil falls sharply
Commodities were mixed on Monday, with silver higher, gold slightly lower and crude oil under heavy pressure. The move left 2 of 6 tracked markets in positive territory.
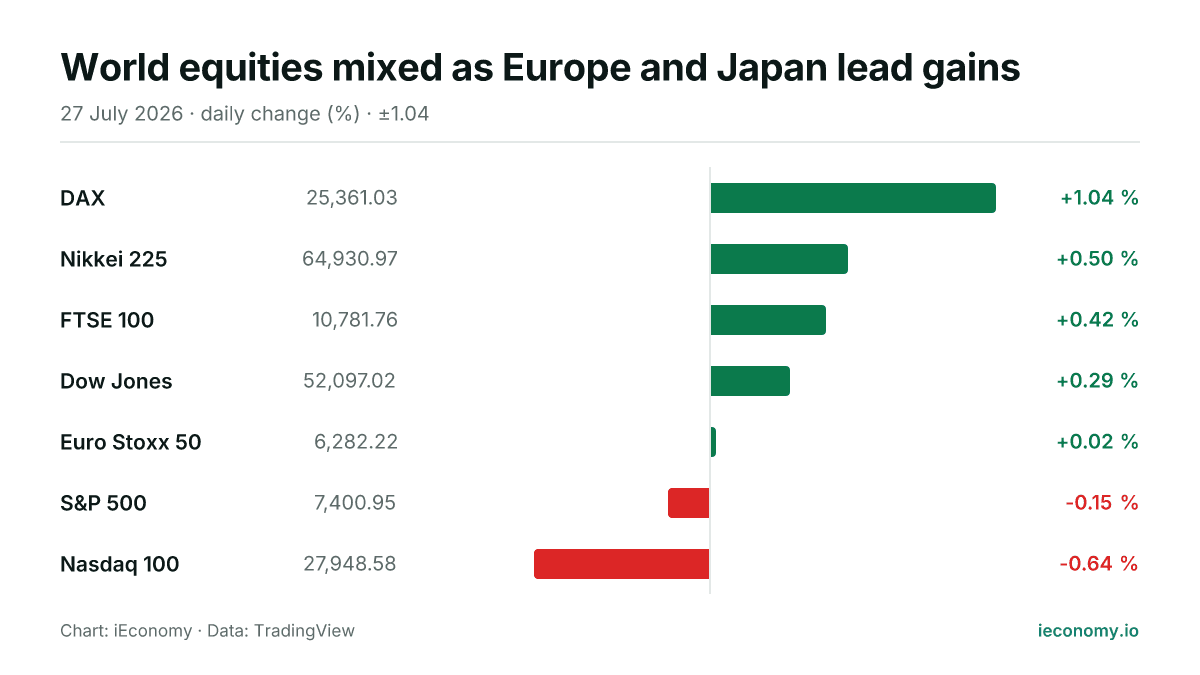
World equities mixed as Europe and Japan lead gains
European benchmarks and Japan advanced, while US large-cap indices were mixed in Monday trading. The DAX and Nikkei 225 led the upside, while the Nasdaq 100 lagged.