S&P 500 slips 0.48% as breadth splits evenly
The S&P 500 ended Monday at 7,619.98, down 0.48% on the day. Among eight tracked constituents, four rose and four fell, with GOOGL the strongest and NVDA the weakest.
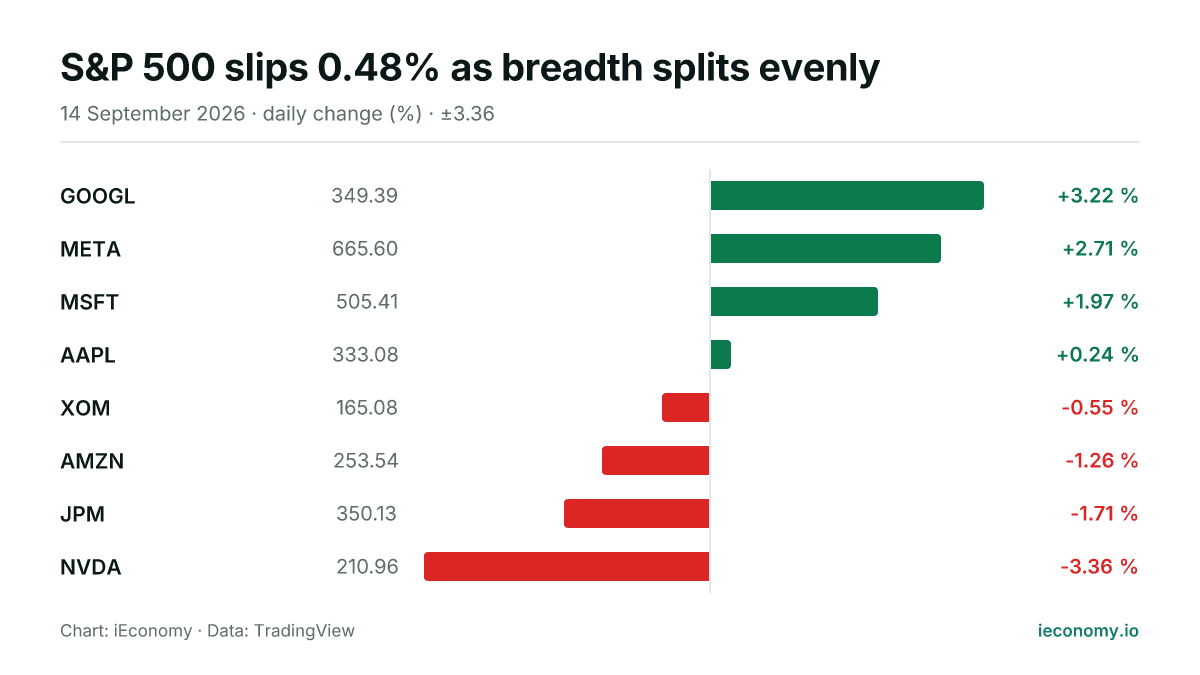
Chart: iEconomy · Data: TradingView
The S&P 500 finished Monday lower at 7,619.98, slipping 0.48% in a session that left the benchmark modestly weaker but not under broad, one-directional pressure. The move was enough to keep the index in negative territory without signaling a disorderly break in sentiment.
How the index moved and how broad the move was
Breadth was evenly split among the eight tracked constituents, with four advancing and four declining. That pattern points to a mixed session rather than a market moving as a single block, even though the index still closed down on balance.
| Stock | Last | Change |
|---|---|---|
| GOOGL | 349.39 | +3.22 % |
| META | 665.60 | +2.71 % |
| MSFT | 505.41 | +1.97 % |
| AAPL | 333.08 | +0.24 % |
| XOM | 165.08 | -0.55 % |
| AMZN | 253.54 | -1.26 % |
| JPM | 350.13 | -1.71 % |
| NVDA | 210.96 | -3.36 % |
For index investors, that matters because the S&P 500 is cap-weighted: a few large constituents can shape the headline result even when the majority of names are not moving in the same direction. In a session like this, the mechanics of weighting can matter as much as the raw advance-decline count.
The standout individual performers
GOOGL was the best performer among the tracked names, rising 3.22% to 349.39. At the other end, NVDA fell 3.36% to 210.96, making it the weakest contributor in the sample.
Those moves show how individual stocks can diverge sharply from the index. A strong gain in one large name can offset weakness elsewhere, while a slide in another can weigh on the benchmark even when several constituents are firmer.
What a long-term investor should take from one session
One trading day is a poor basis for drawing durable conclusions. Short-term swings are often driven by positioning, rebalancing flows and the arithmetic of index weighting, rather than a clean reassessment of long-run fundamentals.
For long-term investors, the main takeaway is to separate noise from signal. A down day with balanced breadth suggests dispersion inside the market, not necessarily a change in the broader investment case, though single-session volatility remains a normal risk.
Sources
Related News
S&P 500 slips 0.48% to 7,636.36 in mixed trade
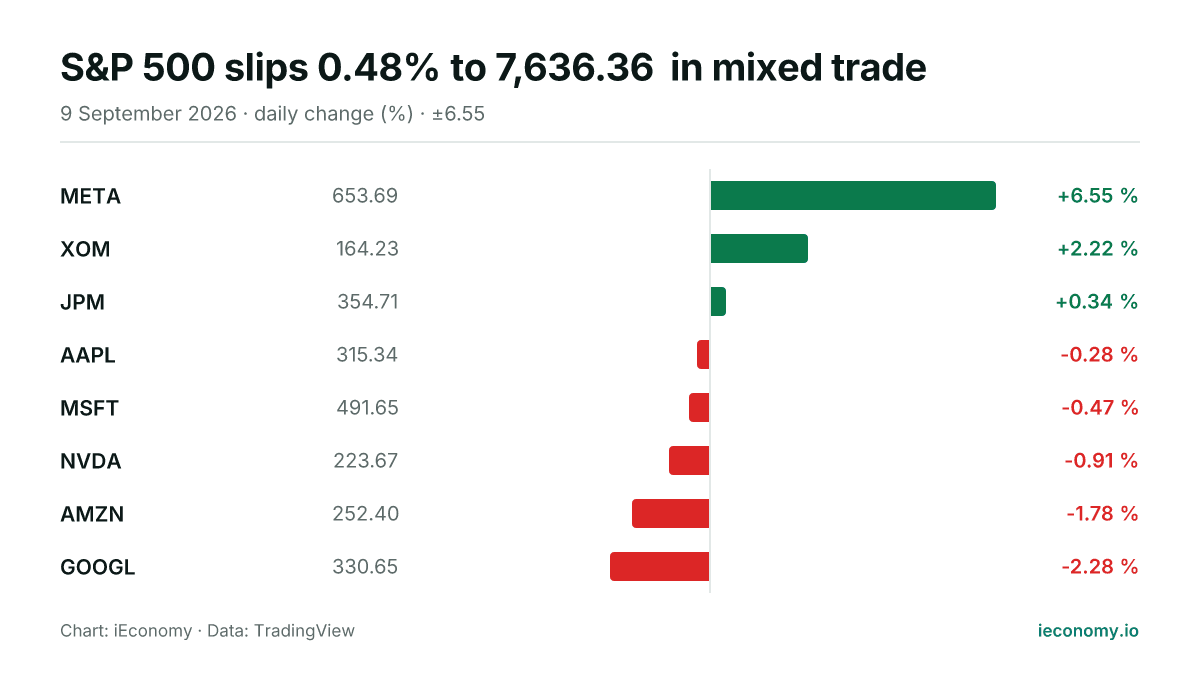
The S&P 500 ended the Wednesday, 2026-09-09 session lower, with 3 of 8 tracked constituents advancing and 5 declining. META was the best performer, while GOOGL was the weakest.
S&P 500 slips 0.58% to 7,673.52 as breadth turns negative
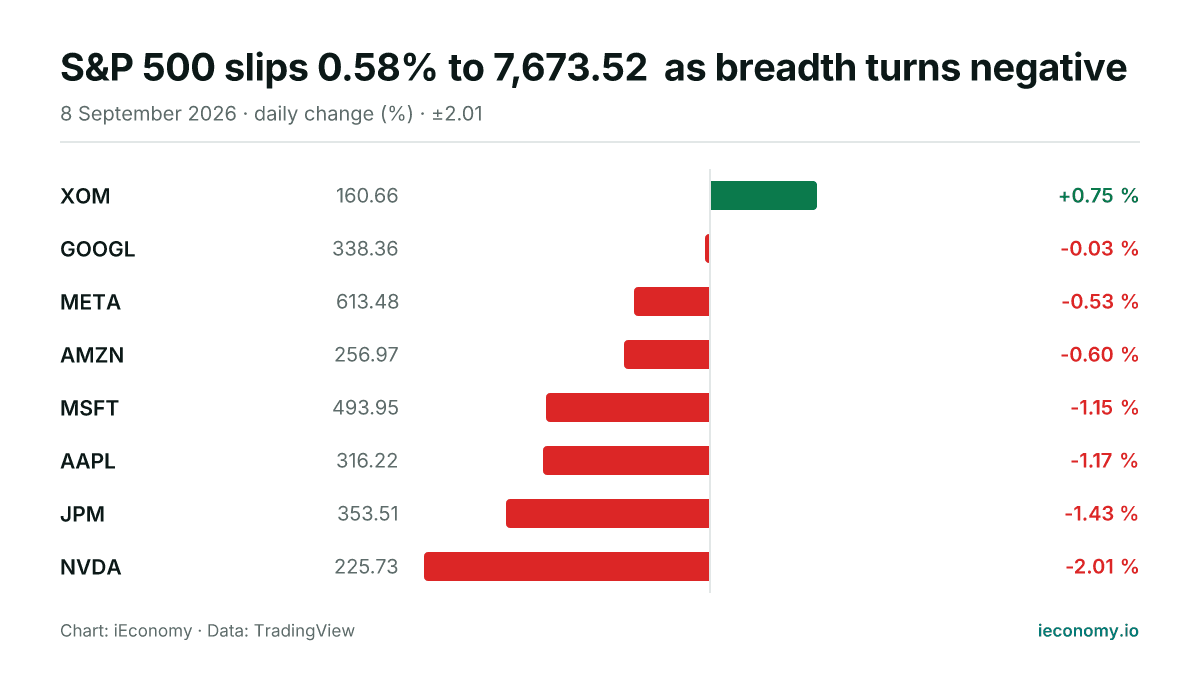
The S&P 500 finished Tuesday lower at 7,673.52, with 7 of 8 tracked constituents declining and only one advancing. NVIDIA was the weakest performer, while Exxon Mobil led the small group higher.
S&P 500 rises 0.46% to 7,666.60 as breadth tilts higher
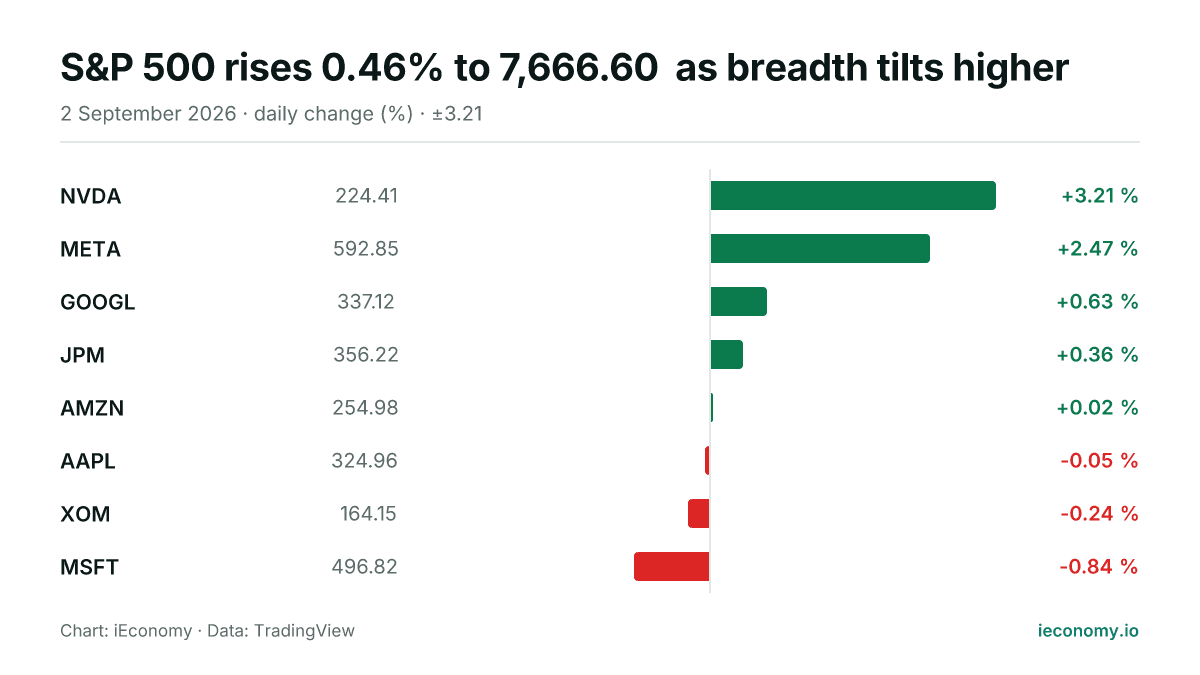
The S&P 500 finished Wednesday at 7,666.60, up 0.46%, with five of eight tracked constituents advancing. NVIDIA was the strongest performer, while Microsoft lagged.
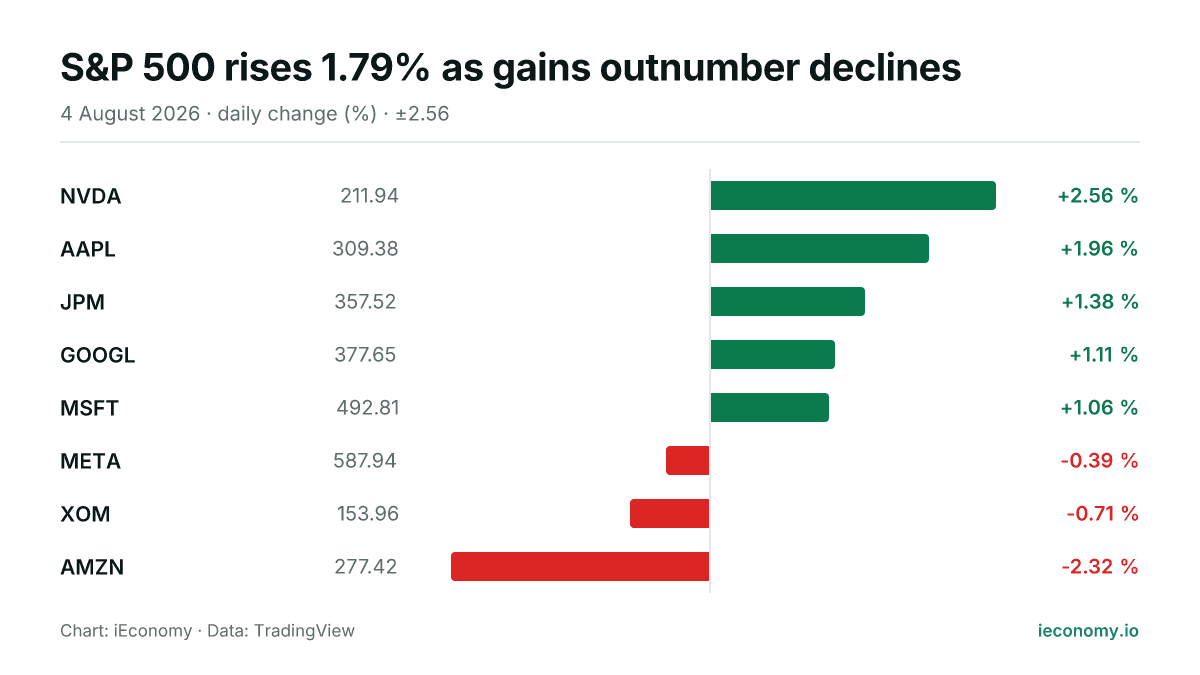
S&P 500 rises 1.79% as gains outnumber declines
The S&P 500 finished Tuesday at 7,736.52, up 1.79%, with five of the eight tracked constituents higher and three lower. NVDA led the day, while AMZN was the weakest performer.
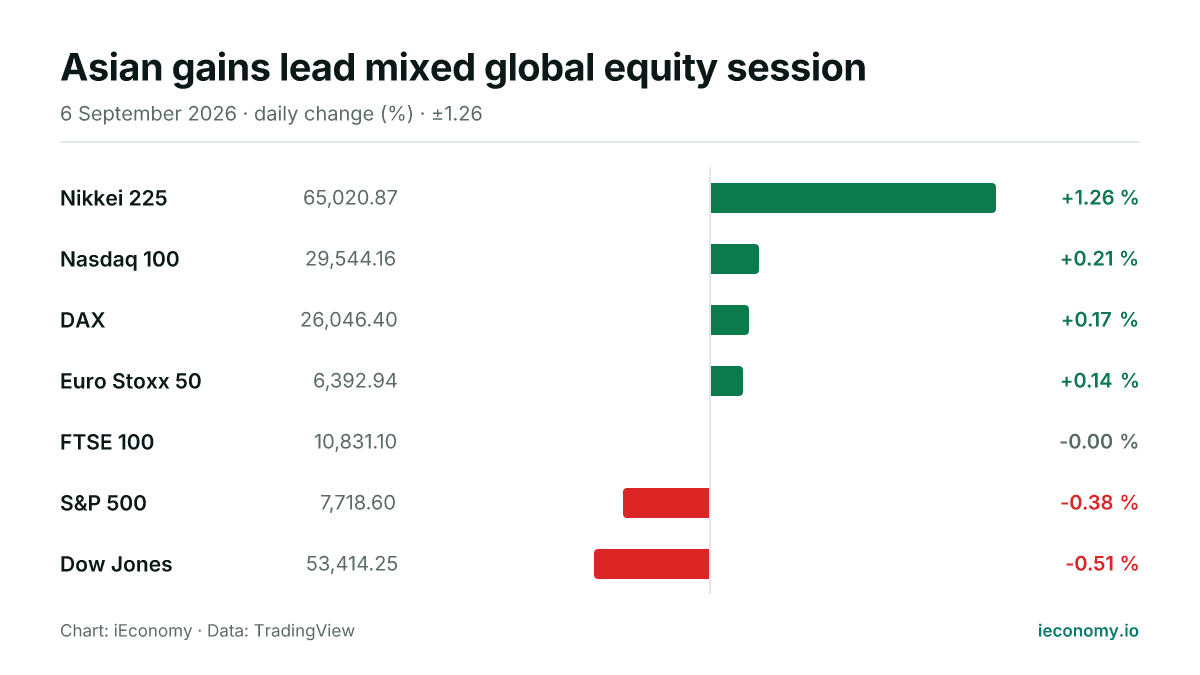
Asian gains lead mixed global equity session
Asian and European indices were firmer while US benchmarks were mixed, with the Nasdaq 100 edging higher and the S&P 500 and Dow Jones lower. The day left a split picture across regions rather than a broad risk-on move.
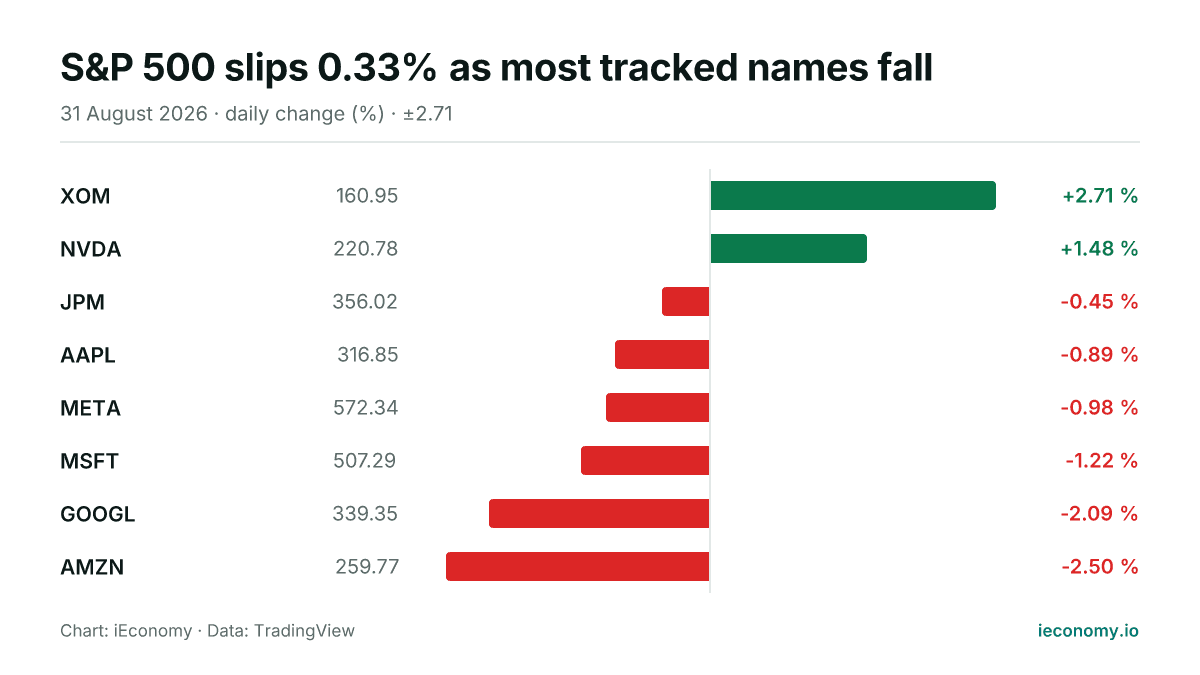
S&P 500 slips 0.33% as most tracked names fall
The S&P 500 ended Monday at 7,686.14, down 0.33% on the session. In the small set of tracked constituents, six fell and two rose, with Exxon Mobil the strongest and Amazon the weakest.