What is a Double Top Pattern?
What does the double top pattern, which is one of the easy to analyze technical patterns frequently preferred by traders in cryptocurrency
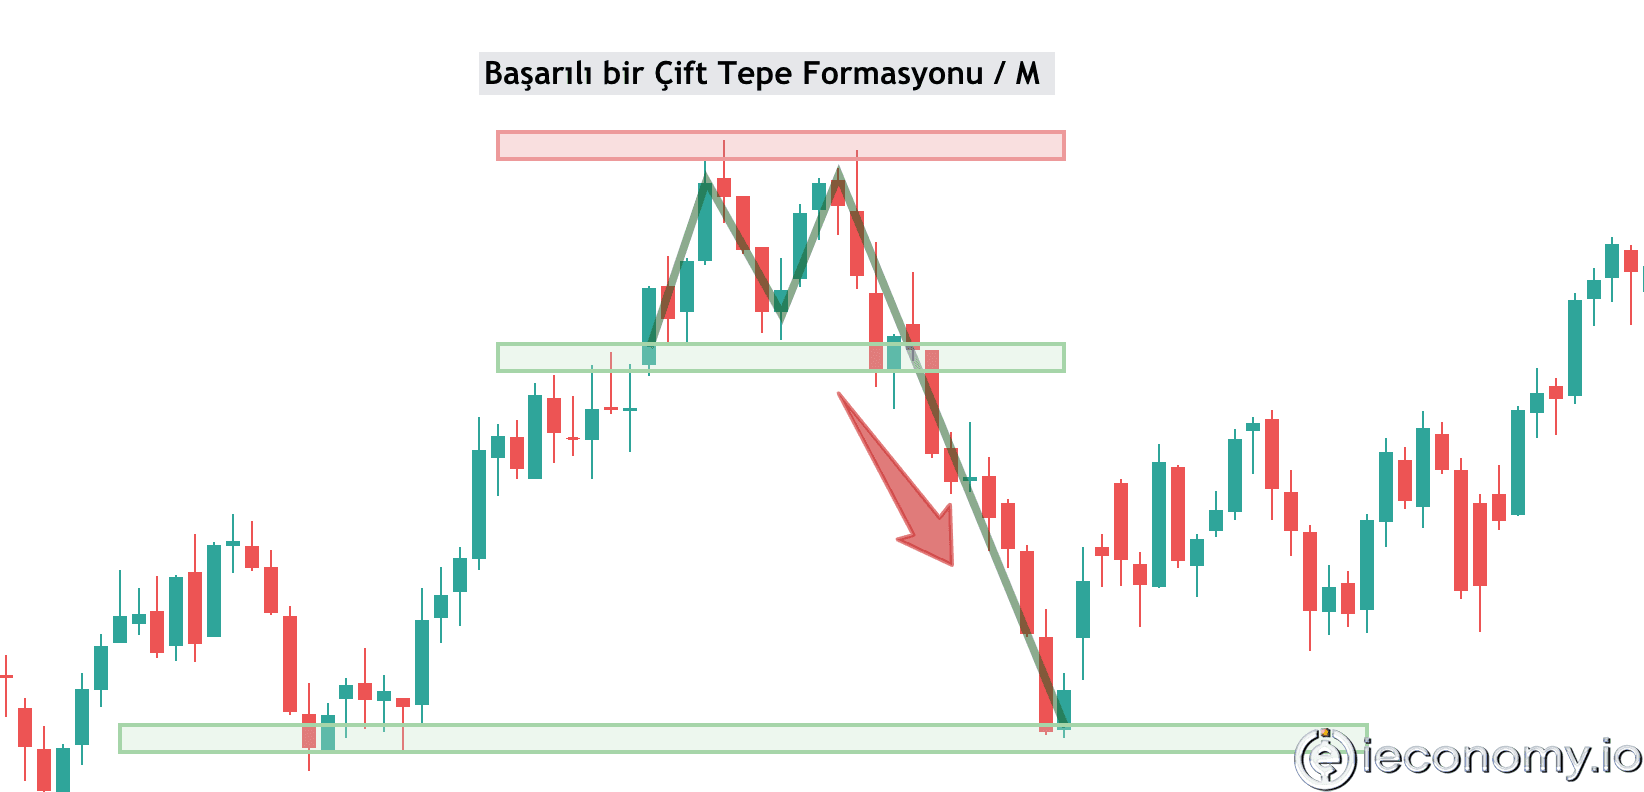
What does the double top pattern, which is one of the easy to analyze technical patterns frequently preferred by traders in cryptocurrency markets, mean? What is a double top pattern target?
This pattern, which is defined as a curious double top or double top pattern in cryptocurrency markets, is assumed by technical analysts to be a harbinger of the end of a strong uptrend. This pattern, which is often used to predict the bearish direction at the end of bullish trends, is also preferred in bearish positions for experienced traders. While the two peaks that form are almost equal to each other, a valley-like gap is observed between the two peaks. At the end of the bull season, success can be achieved with double top patterns. A double top is formed with a reaction rally after a decline. A reaction rally after the first decline from the peak forms the second top. It stops very close to or at the same level as the second low.What happens after a double top pattern?
After a double top pattern, the bull's end is announced. Periodically, a double top pattern may also form in bearish scenarios. Double tops at the end of the bullish season have high size and price ranges. During bearish periods, it can record rare earnings tops. After seeing the double top, there is a possibility of waiting for a decline until the neck area. As well as the peaks that form become resistance points. If the trend line is drawn, the resistance point is easily observed from the peaks. Likewise, if the neck works as a support, the path towards the W pattern opens.
What is a chart double top pattern?
It is a price chart pattern that appears on the price chart when the uptrend ends and a downtrend begins. At some point when the price continues to fall rapidly, traders make their first purchases in the belief that the uptrend will begin. This creates the first bottom reversal and the price turns upwards. The price goes up for a while, encouraging sellers who believe that the decline will continue, and the price turns down again. It is important to get confirmation from the chart to know whether it is a double top or a W pattern. Risk-loving traders can use stops to enter the position at the bottom and wink at the W pattern. In the absence of an uptrend, the neckline is broken and new lows are recorded.What does a double top pattern mean in the that identifies downtrends. A pattern is a form of formation and upbringing. It can be thought of as strengthening the education received on any subject. The W pattern shows the return of a bearish price to a bottom resistance point by peaking with the correction movement that develops after seeing the bottom level. What is the W pattern, what does it mean? How it works, what happens afterwards, we have compiled it with all the details. https://ieconomy.io/en/what-is-the-w-formation-what-does-it-mean-how-does-it-work/
Frequently asked questions
What is a double top pattern in technical analysis?
A double top pattern is a bearish reversal chart formation identified in technical analysis, characterized by two distinct peaks at approximately the same price level separated by a trough. It is interpreted by analysts as a signal that a prevailing uptrend may be exhausting and a potential trend reversal to the downside could follow.
How is a double top pattern used to set a price target?
The pattern's measured move target is typically projected by calculating the vertical distance from the peak highs to the trough low (the 'neckline') and then extending that same distance downward from the point where the price breaks below the neckline support level. This provides a technical estimate for the potential minimum decline following the pattern's completion.
What typically happens after a confirmed double top pattern?
After a confirmed double top pattern, where the price decisively breaks below the support level formed by the trough between the two peaks, a bearish reversal is anticipated. This break signals that selling pressure has overcome the prior uptrend, often leading to a sustained downward price movement.
Can a double top pattern appear in different market contexts?
While primarily a bearish reversal pattern signaling the end of an uptrend, similar double-top formations can also be observed and analyzed within broader bearish or ranging market scenarios. However, its classic interpretation as a reversal signal is most significant when it forms after a sustained bullish advance.
Related News

Candlestick Patterns: Chart Formations and What They Mean
Single, two and three-candle patterns — doji, hammer, bullish engulfing, morning star — with the structure of each, the trend it is looked for in, and an original diagram for every one.

Stock Market Hours and Holidays: NYSE and Nasdaq Guide
A clear reference to regular U.S. stock market hours, pre-market and after-hours trading, early closes, holiday closures, and how bond-market holidays differ.

How to Cash In Savings Bonds: Electronic and Paper
Learn how to redeem U.S. savings bonds through TreasuryDirect or a bank, when penalties apply, how partial redemptions work, and what to do with inherited or lost bonds.

Bitcoin (BTC) Explained by Cryptanalysis Platform Glassnode
Glassnode stated that short-term Bitcoin (BTC) investors have started to save. Bitcoin (BTC), the cryptocurrency leader
What is Momentum Indicator?
What is Momentum Indicator? Things people are curious about Momentum Indicator. What is Momentum Indicator, how is it calculated and how is it interpreted?

What Is The US News ETF Rankings?
The U.S. News Best Fit ETF list is structured to help long-term buyers determine and evaluate the effectiveness of exchange-traded funds.