What is ADX Indicator?
What is ADX Indicator? What you need to know about ADX Indicator: What is the ADX Indicator, how is it calculated, and how is it interpreted?

Unknown author / Wikimedia Commons (CC0)
How to Add ADX Indicator?
The ADX Indicator can be easily used through the Meta Trader platform; as we have mentioned in all other content, we publish on the topic. Thanks to its useful and straightforward interface, this platform facilitates access to the desired information, and multiple indicators can be worked simultaneously. The indicators selected from the left part of the screen can be easily analyzed by dragging them to the same window.
Frequently asked questions
What does the ADX indicator measure in technical analysis?
The ADX indicator measures the strength of a trend, regardless of its direction. It quantifies whether a market is trending strongly or moving sideways in a weak trend.
How are ADX indicator values interpreted to determine trend strength?
An ADX value below 20 typically indicates a weak or absent trend, while a value above 40 suggests a strong trend. Values above 50-60 are rare and signify exceptionally powerful momentum.
Who created the ADX indicator and what other common tools is it related to?
The ADX indicator was developed by J. Welles Wilder, who also created the RSI. It is derived from the Positive and Negative Directional Indicators (+DI and -DI) and is often used in conjunction with them.
Is the ADX indicator typically used alone for trading signals?
No, the ADX is generally not used solo. It is primarily employed to support and verify a primary trading strategy by confirming the presence and strength of a trend.
Related News

What Is Compound Interest? Why Starting Early Can Matter More Than the Rate
Compound interest is when your returns start earning returns of their own. Starting early can beat a higher rate — we show the exact math with a worked example.
Candlestick Patterns: Chart Formations and What They Mean
Single, two and three-candle patterns — doji, hammer, bullish engulfing, morning star — with the structure of each, the trend it is looked for in, and an original diagram for every one.

Stock Market Hours and Holidays: NYSE and Nasdaq Guide
A clear reference to regular U.S. stock market hours, pre-market and after-hours trading, early closes, holiday closures, and how bond-market holidays differ.

What is Borsa Istanbul (BIST)
Borsa Istanbul (BIST) is the organization that brings investors together and ensures that trading is carried out on a safe, fair and

What is the Cac 40 Index? Curiosities About the Index
The Cac 40, the French Stock Market Index, is composed of 40 multinational companies among the 100 largest by...
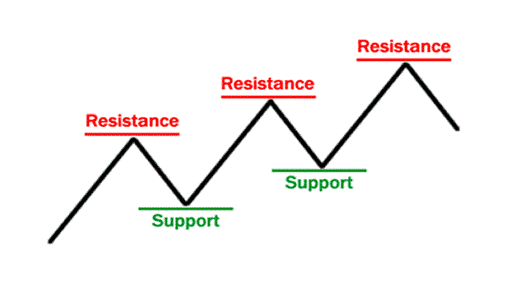
What is Support and Resistance?
Support and resistance are the most frequently heard concepts in the forex market, as well as technical analysis concepts used in all financial markets.