What is Forex Technical Analysis?
Technical analysis method is an important indicator used by investors in order to predict the price trends of investment instruments...

is an important indicator used by investors in order to predict the price trends of investment instruments not only in forex markets but also in all financial markets. Technical analysis is an analysis used to predict future price changes based on past price changes based on rational calculations.
Technical analysis is based on the principle that prices move as a whole in relation to each other. In other words, changes in prices follow each other in a continuous cycle. Although fundamental and technical analysis used in the markets may seem different from each other, they are in fact interconnected. However, the difference between them is that in fundamental analysis, investment instruments are evaluated based on economic information, while in technical analysis, they are evaluated based on past price changes. If you want to get more detailed information on both technical analysis and fundamental analysis in Forex markets, you can benefit from the free trainings we offer as Integral Investment. You can contact us at a time that suits you from the training calendar on our website and receive your training without changing your location.
What should be considered in Technical Analysis?
1- Changes in prices take into account all factors affecting the market. All economic, political or social factors that will affect price trends have already been taken into account and reflected in the price charts of investment instruments. In short, the price is actually an important indicator that reflects all the factors affecting the market.
2- Prices always change in a certain trend. This analysis is based on the "Dow Theory". Dow theory is based on 6 basic principles. These are as follows
- Indices contain all factors.
- There are 3 basic trends (direction of the index) in the market.
- Each trend consists of 3 phases.
- Trading volume should support the trend.
- Indices should support each other.
- The direction of the trend remains the same unless there is a signal that ends the current trend.
3- 'History repeats itself', meaning the past repeats itself. In other words, one can predict where prices will go by looking at past changes.
Charts are the most basic information tools in technical analysis. The OHLC chart brings together the opening, closing, high and low price information for a given time period. This provides a source of information about how prices will be in the future. Candlestick charts show the difference between the opening and closing of prices in the form of bars in many ways such as minute, hourly, daily or monthly. For technical or fundamental analysis, you can get live analysis support from the expert team in our Research Department every weekday between 8:30-17:30.Frequently asked questions
What is the core principle of forex technical analysis?
The core principle of forex technical analysis is that future price movements can be predicted by studying past price action and chart patterns. It operates on the idea that prices move in trends and that historical price behavior tends to repeat itself due to market psychology.
How does technical analysis differ from fundamental analysis in forex?
Technical analysis focuses on studying price charts, patterns, and technical indicators derived from past market data to forecast trends. In contrast, fundamental analysis evaluates currencies based on economic factors like interest rates, GDP, and geopolitical events.
What kind of data does forex technical analysis primarily use?
Forex technical analysis primarily uses historical price data, trading volume, and chart formations. Analysts apply this data to tools like trend lines, support and resistance levels, and mathematical indicators to identify potential trading opportunities.
Is technical analysis applicable only to the forex market?
No, technical analysis is a methodology used across all financial markets, including stocks, commodities, and indices. The principles of analyzing price charts and trends are universal, though the specific assets and volatility characteristics differ.
Related News

Candlestick Patterns: Chart Formations and What They Mean
Single, two and three-candle patterns — doji, hammer, bullish engulfing, morning star — with the structure of each, the trend it is looked for in, and an original diagram for every one.

Stock Market Hours and Holidays: NYSE and Nasdaq Guide
A clear reference to regular U.S. stock market hours, pre-market and after-hours trading, early closes, holiday closures, and how bond-market holidays differ.

How to Cash In Savings Bonds: Electronic and Paper
Learn how to redeem U.S. savings bonds through TreasuryDirect or a bank, when penalties apply, how partial redemptions work, and what to do with inherited or lost bonds.

What is VIOP 30 Index
What is VİOP 30 Index VİOP is an investment area within Borsa Istanbul. The question of what is the VIOP 30 index, which is curious in this investment area, is in mind.
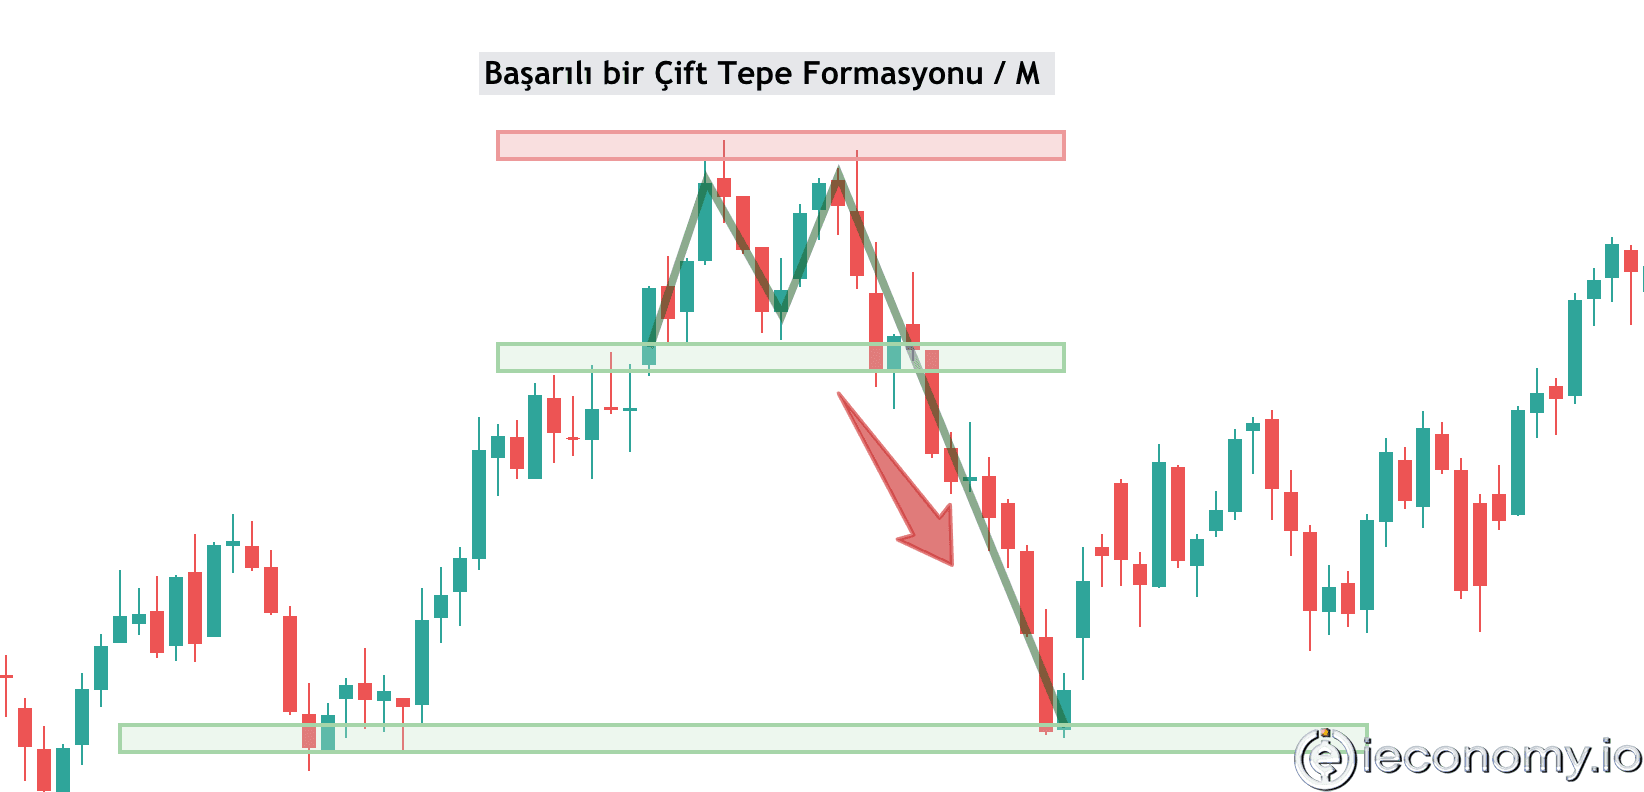
What is a Double Top Pattern?
What does the double top pattern, which is one of the easy to analyze technical patterns frequently preferred by traders in cryptocurrency

What Is Book Value & How Is It Calculated?
Book value is the equity value reported in a company's financial statements. The book value figure is typically seen in relation to the company's stock value (market capitalization).