What is the RSI Indicator?
What is the RSI Indicator? Things people are curious about RSI Indicator. How is the RSI Indicator calculated and how is it interpreted?
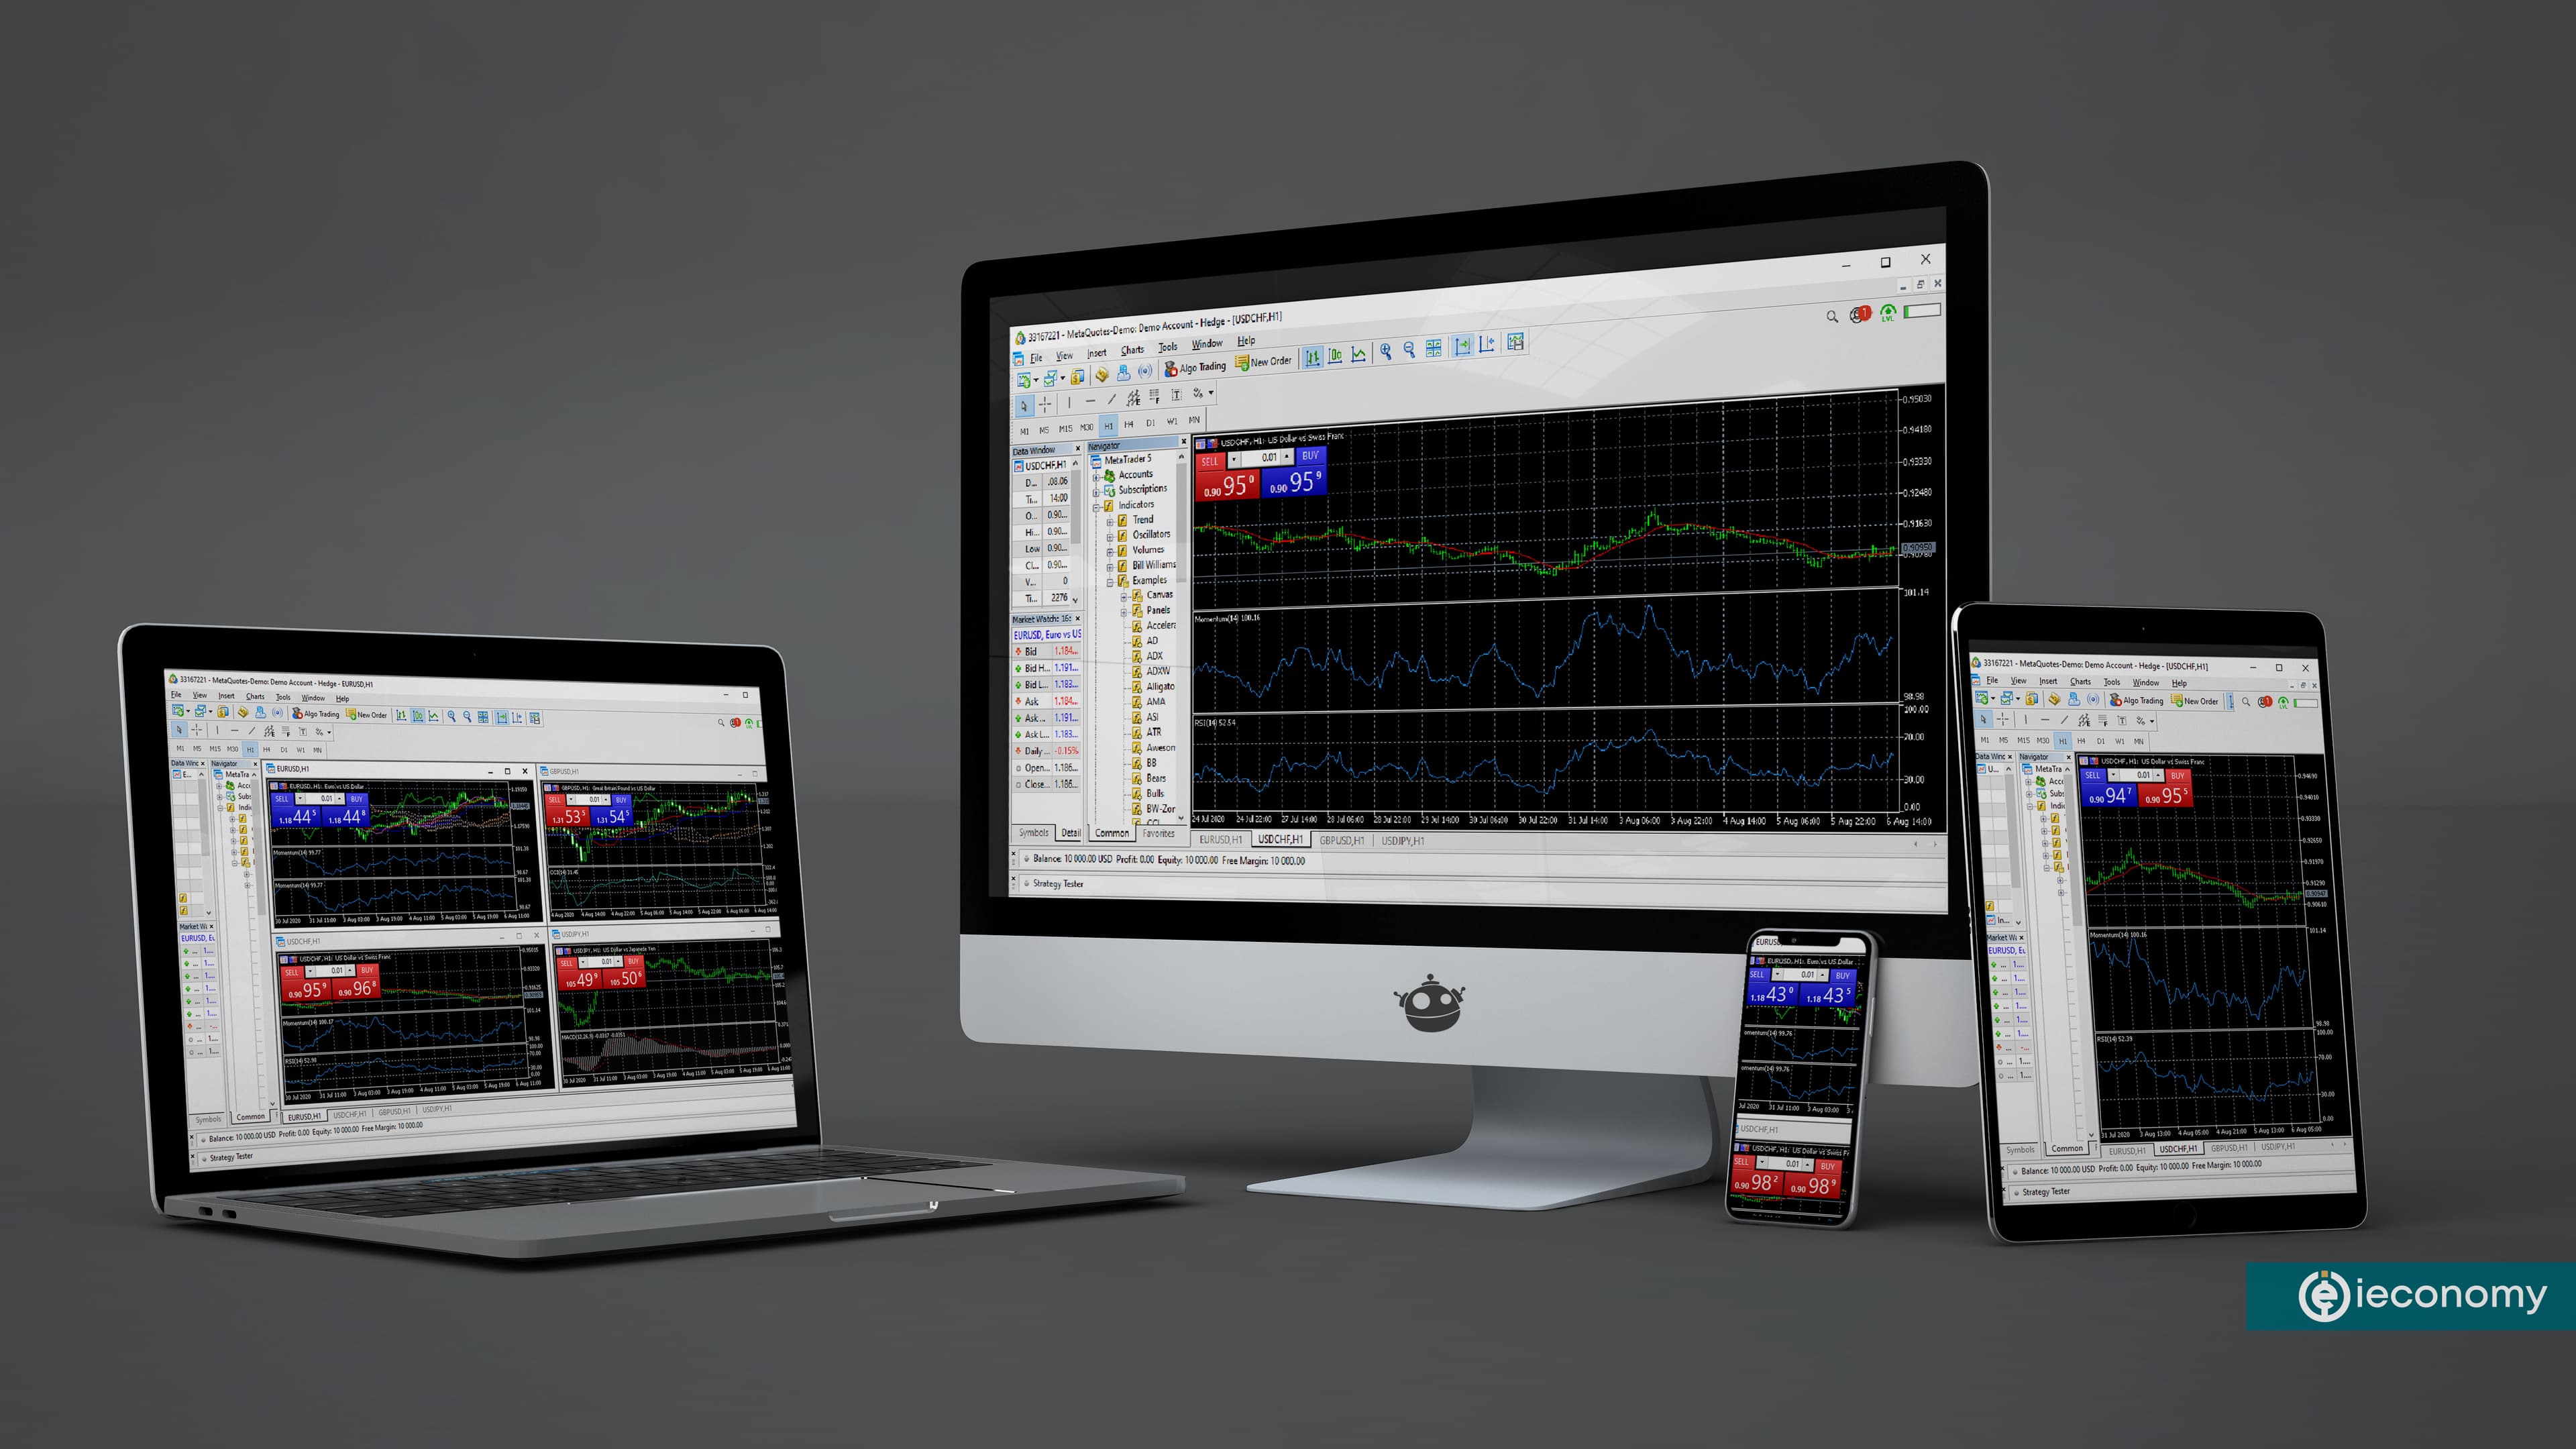
 This platform, which is widely used by companies offering professional Forex services, helps you to have an idea for your investments with its easy interface.
 By downloading this application to your computer, tablet or phone, you can select the indicators on the left side of the screen and drag them to the main screen. You can interpret the automatically calculated indicators with the tips we offer you.
Frequently asked questions
What is the RSI indicator used for in trading?
The RSI indicator is primarily used to identify overbought and oversold conditions in a financial instrument, as well as to detect potential trend reversals through divergences known as mismatches. It helps traders assess the momentum of price changes over a specified period.
How is the RSI indicator calculated?
The RSI is calculated automatically by trading platforms like MetaTrader, typically over a default period of 14 days, by comparing the magnitude of recent gains to recent losses. This calculation generates an oscillator value between 0 and 100, which is then plotted for analysis.
What do overbought and oversold RSI levels indicate?
Overbought RSI levels, generally above 70, suggest an asset may be overvalued and could be due for a price correction or pullback. Conversely, oversold levels, typically below 30, indicate an asset may be undervalued and could potentially see a price rebound.
What is an RSI divergence or mismatch?
An RSI divergence, or mismatch, occurs when the price of an asset moves in the opposite direction of the RSI indicator, signaling a potential weakening of the current trend. This is used by traders as a warning sign of a possible upcoming trend reversal.
Related News

What Is Compound Interest? Why Starting Early Can Matter More Than the Rate
Compound interest is when your returns start earning returns of their own. Starting early can beat a higher rate — we show the exact math with a worked example.

Candlestick Patterns: Chart Formations and What They Mean
Single, two and three-candle patterns — doji, hammer, bullish engulfing, morning star — with the structure of each, the trend it is looked for in, and an original diagram for every one.

Stock Market Hours and Holidays: NYSE and Nasdaq Guide
A clear reference to regular U.S. stock market hours, pre-market and after-hours trading, early closes, holiday closures, and how bond-market holidays differ.

What Is a P/E Ratio? A Practical Investor Guide
A plain-English guide to the price-to-earnings ratio, including trailing and forward P/E, why earnings quality matters, when the metric fails, and which valuation tools to use instead.
What is Earnings Season and What to Consider in Earnings Reports?
Earnings season is a period each fiscal quarter, usually lasting several weeks, when many of the largest listed companies release their latest

What is VOIP Expand On
What is VOIP Expand On VİOP, which is a favorite of investors, comes alive in mind as a foreign term.