S&P 500 slips 0.71% as breadth turns negative
The S&P 500 finished the Tuesday session at 7,631.47, down 0.71%. Among eight tracked constituents, three rose and five fell, with Apple the strongest and Amazon the weakest.
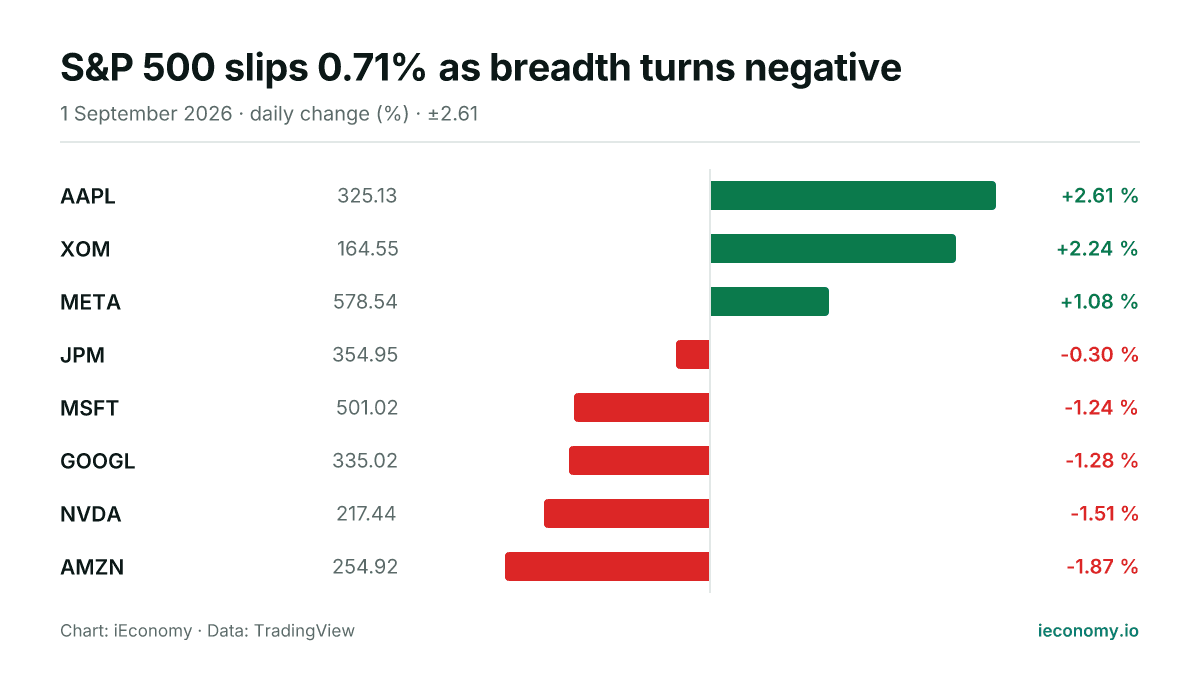
Chart: iEconomy · Data: TradingView
The S&P 500 ended the Tuesday session at 7,631.47, down 0.71% on the day. The move was negative but not disorderly, with trading showing a modest tilt toward losers rather than a broad capitulation.
How the index moved and how broad the move was
Of the eight constituents tracked in the digest, three finished higher and five lower. That split points to a session in which selling pressure was more common than buying interest, but still not overwhelming across the sample.
| Stock | Last | Change |
|---|---|---|
| AAPL | 325.13 | +2.61 % |
| XOM | 164.55 | +2.24 % |
| META | 578.54 | +1.08 % |
| JPM | 354.95 | -0.30 % |
| MSFT | 501.02 | -1.24 % |
| GOOGL | 335.02 | -1.28 % |
| NVDA | 217.44 | -1.51 % |
| AMZN | 254.92 | -1.87 % |
For the index, that kind of breadth usually means the headline move is being shaped by a slight imbalance in individual stock performance rather than by one uniform shift across the whole market. On a single session, that distinction matters more than the size of the index change alone.
Standout individual performers
AAPL was the strongest of the tracked names, rising 2.61% to 325.13. AMZN was the weakest, falling 1.87% to 254.92.
When a small set of large constituents moves in different directions, the index can still decline even if some high-profile names hold up. The session therefore reflects dispersion within the group, not a straight-line move in one direction.
What a long-term investor should take from one session
One day’s move mainly shows how prices are being balanced at that moment, not a durable trend by itself. The mechanics are simple: index performance reflects the net effect of advancing and declining members, weighted by their size.
For a long-term investor, the useful takeaway is that short sessions can be dominated by temporary shifts in breadth and stock-specific trading. A single decline does not by itself redefine the broader path of the market, but it does highlight near-term volatility and dispersion.
Sources
Related News
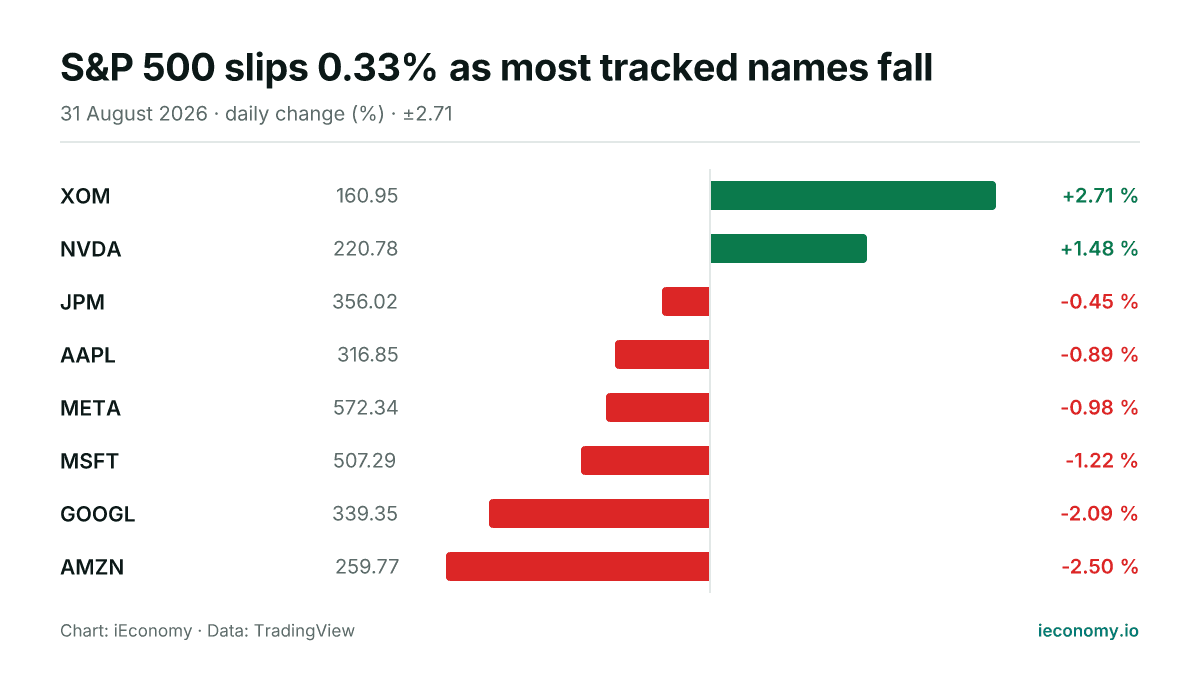
S&P 500 slips 0.33% as most tracked names fall
The S&P 500 ended Monday at 7,686.14, down 0.33% on the session. In the small set of tracked constituents, six fell and two rose, with Exxon Mobil the strongest and Amazon the weakest.
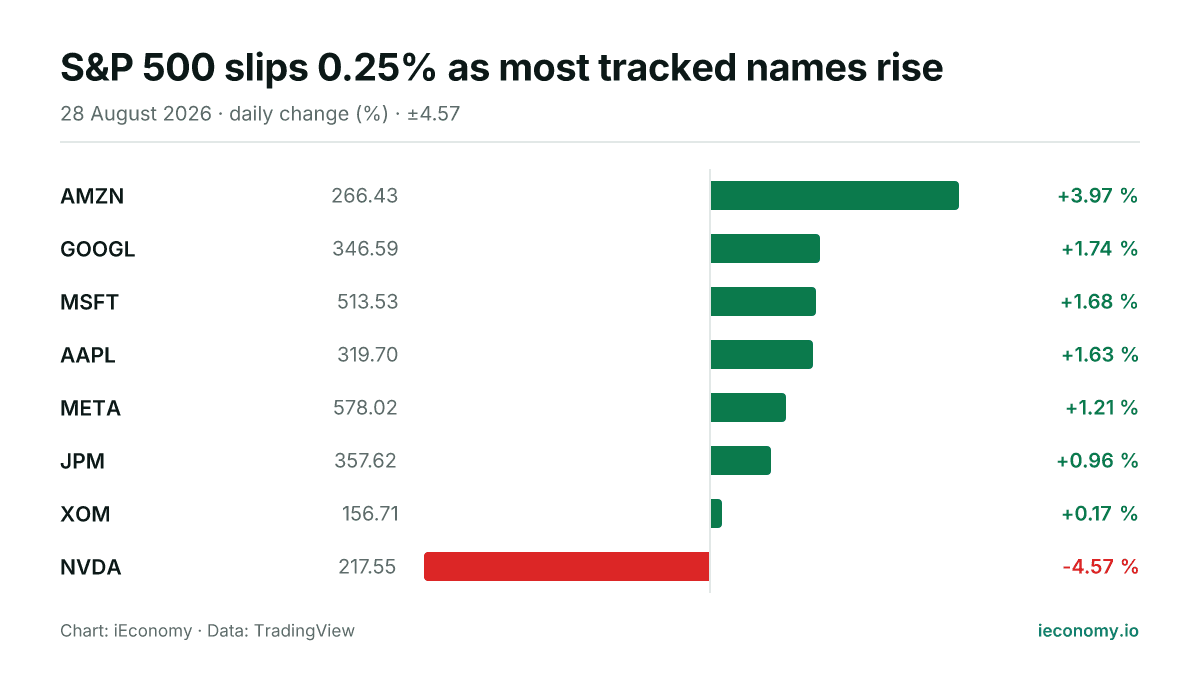
S&P 500 slips 0.25% as most tracked names rise
The S&P 500 finished Friday at 7,711.76, down 0.25% on the day. Breadth was positive among the tracked constituents, but a sharp fall in NVDA offset gains elsewhere.
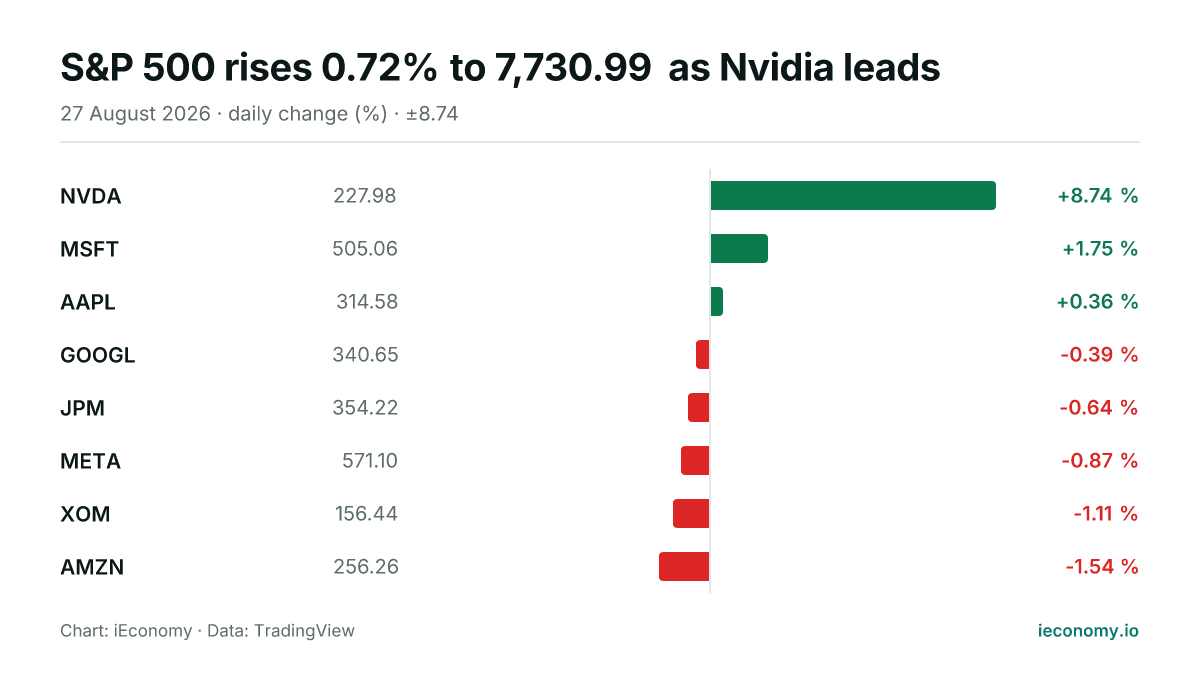
S&P 500 rises 0.72% to 7,730.99 as Nvidia leads
The S&P 500 advanced on Thursday, with a narrow majority of tracked constituents higher. Nvidia was the strongest performer, while Amazon lagged the group.
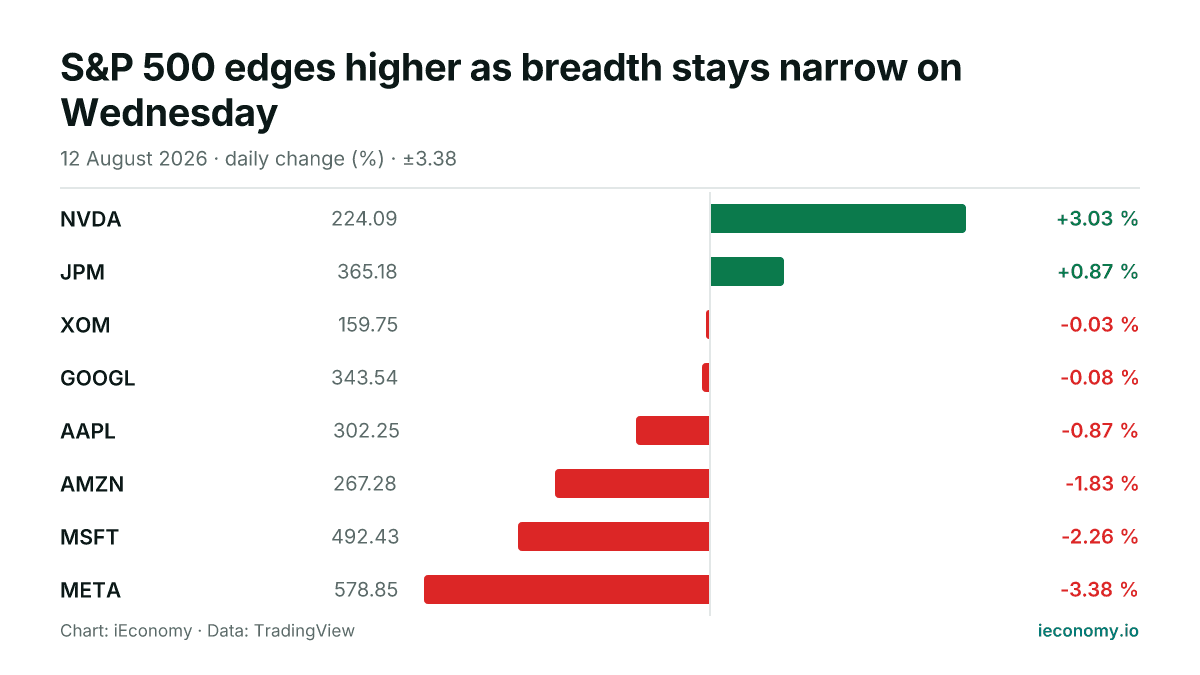
S&P 500 edges higher as breadth stays narrow on Wednesday
The S&P 500 finished Wednesday at 7,748.50, up 0.26%, with only 2 of the 8 tracked constituents rising. NVDA was the strongest performer, while META was the weakest.
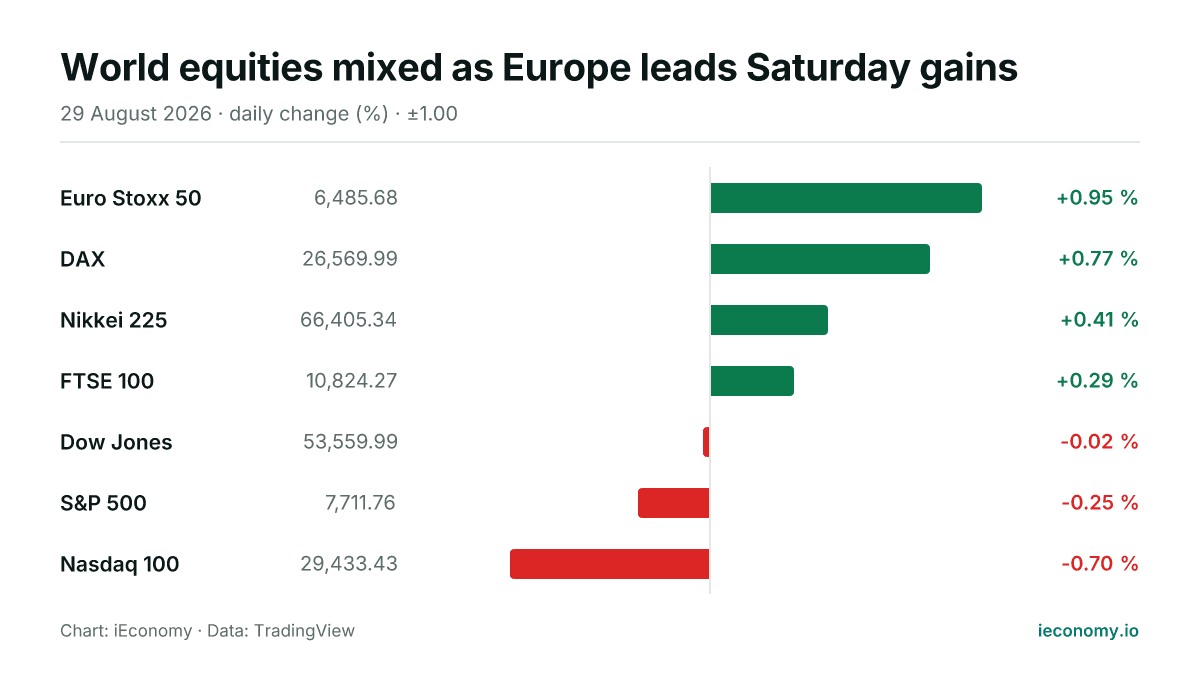
World equities mixed as Europe leads Saturday gains
European benchmarks outperformed on Saturday, with the Euro Stoxx 50 and DAX posting the strongest advances. US indices were softer, while Asian equities were also firmer, led by the Nikkei 225.
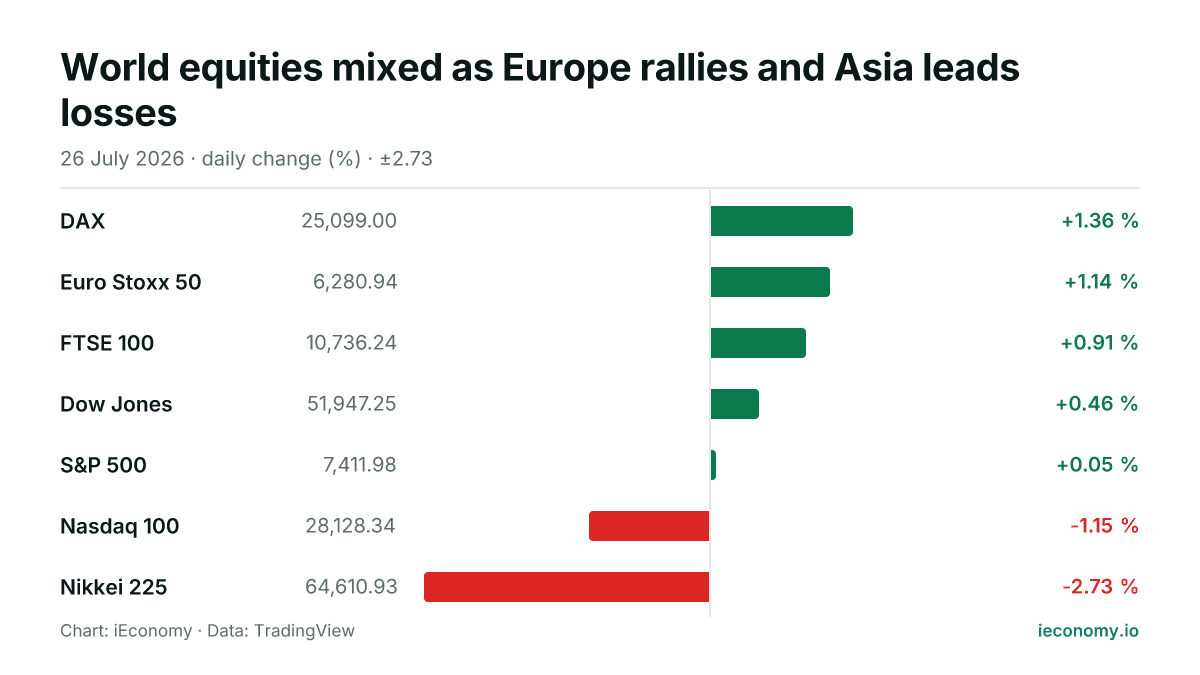
World equities mixed as Europe rallies and Asia leads losses
European benchmarks advanced while US indexes were broadly firmer and Asia finished lower, with the Nasdaq 100 and Nikkei 225 lagging. The day left 5 of 7 tracked indices higher, but the dispersion was wide.