What Is an Indicator? Technical Analysis Indicator Types
What is an indicator, what types exist, and how are they used? We explain what RSI, MACD, moving averages, and volume tools actually measure.

Unknown author / Wikimedia Commons (CC0)
Scroll beneath almost any price chart and you'll hit a second layer. Wavy lines. Colored bands hugging the price. A histogram flickering above and below a middle line. That layer has one name: indicators. A technical indicator is a number or line worked out from an asset's past price and trading volume. It uses a fixed formula.
An indicator does not produce the future. It repackages what already happened, seen from a new angle. That is the whole promise it makes. This guide covers what an indicator is, the four families most fall into, and where each stops being useful.
Looking for one specific tool — RSI, MACD, a moving average? Each has its own page, linked below in the roundup of the most used ones. Here, we build the shared logic first.
What Is a Technical Indicator?
The word means exactly what it sounds like: a gauge. Past price, trading volume, or both, gets run through a formula. The result becomes a line, a band, or a histogram on the chart. The formula changes from tool to tool. The input never does — it is always data already on record.
That is the single most important fact about any indicator: it always looks backward. A moving average shows the average price of the last several days, not the price right now. An RSI reading shows recent gains against recent losses, not what happens tomorrow. Neither is built to see forward. Both summarize what already happened.
Almost every indicator has a period setting: how many days or candles feed the formula. Shorter periods react faster but flip more often; longer ones are smoother but confirm change later. There is no single "correct" period, only a trade-off.
This is also what separates an indicator from the raw price chart under it. The price chart shows every trade as it happened. An indicator boils that same data down into one reading. That's useful, since it strips out noise, but it can just as easily smooth over a detail that mattered. Reading both together builds context neither gives alone.
None of these formulas are secret. Most were published decades ago, and platforms still run them the same way. Even a tool a broker calls its own is often just a small variation on a standard formula.
Charting software does this math for you. The same logic applies to a stock exchange listing, a foreign-exchange pair, or a crypto market. What changes is not the formula, but what counts as a useful reading in that market. That's why knowing what an indicator measures matters more than memorizing it.
What Are the Types of Technical Indicators?
Markets get tracked along four questions. Which way is price going, how fast, how much is it swinging, and how many people are trading? Almost every indicator belongs to one of these four families.
Trend indicators show which way price is heading. The moving average is the best-known example. It averages recent closing prices and compares that average with the current price. Price above its own average often reads as an uptrend; below it, a downtrend. A related tool, ADX, measures how strong that trend is rather than its direction. A low ADX reading means price isn't following a clear path either way. Traders often pair a trend reading with support and resistance levels to frame where it might stall.
Momentum indicators measure how fast price is changing, not where it stands. Because they track speed, not level, a momentum reading can catch a slowdown before a trend indicator does. RSI and MACD are the two most used tools in this family. Both work with the rate of change in price, not price itself.
**Volatility indicators** show how much price is swinging, not which way it favors. Bollinger Bands are the standard example. An upper and lower band is drawn around price, based on its recent average deviation. When those bands narrow, price has simply been moving less than usual. That's it — nothing about which way comes next. Volatility is a separate concept from direction. Mixing the two up is a common misreading of this family.
Volume indicators measure how many units changed hands: how much trading sits behind a price move. A move backed by high volume reflects more buyers or sellers behind it. The same move on thin volume reflects less. On-Balance Volume (OBV) is the standard case. It adds volume on days price closed higher. It subtracts volume on days price closed lower, into one running line. Two price moves of the same size can carry very different weight. It depends on the trading volume behind each.
How Are Indicators Actually Used?
Some indicators sit directly on the price chart, sharing the same scale as price. A moving average is the clearest example. Others sit in their own pane below the chart, moving on a fixed scale, often 0 to 100. These are called oscillators. RSI is the standard case here.
A simple example makes the lag concrete. Say a stock closes at $100, $102, $104, $106 and $108 over five straight days, purely as an example. The five-day average is (100+102+104+106+108) ÷ 5 = $104. Price right now trades at $108. The average still reads $104, since it reflects the last five days, not the current price.
Period length changes how visible that lag is. Compare a 14-day moving average with a 50-day one on the same stock. When price reverses sharply, the 14-day average catches up within days; the 50-day average can take weeks. Short periods react fast but reverse more often on noise. Long periods are smoother but confirm a real change later. Neither is "more correct". It is a trade-off, tied to how long you hold a position.
Piling on indicators is a common habit that rarely helps. A chart can hold a dozen tools. A cluttered one is harder to read than a focused one. Two or three indicators from different families tend to build a fuller picture. Ten tools all measuring some version of the same thing rarely do.
One pattern comes up often enough to have its own name: divergence. Price makes a new high, but a momentum indicator does not confirm it with a new high of its own. The two have diverged. That's an observation about price and the indicator disagreeing right now, not a promise about what happens next.
What's the Difference Between an Indicator and an Oscillator?
Indicator is the umbrella term. Any reading calculated from past price or volume data qualifies. Oscillator describes a smaller group within that. It's one that moves within a bounded range, often 0 to 100, rather than tracking price's own scale. RSI is an oscillator. A moving average is not.
That distinction has a practical use. An oscillator's fixed scale lets you compare two very unlike assets on the same 0-to-100 axis. Take a stock against a currency pair, for instance. A moving average shares price's own units. Comparing a $9 stock's average with a $900 stock's tells you nothing on its own.
Which Indicators Are Most Widely Used?
Each family has a handful of tools that dominate everyday use. The links below go to a full page on each, with its exact calculation and how it's read.
In the trend family, the moving average is the most common starting point, followed by Ichimoku. It's a Japanese charting system created by journalist Goichi Hosoda in the 1930s. It combines several moving averages and a projected cloud region in one view. Measuring how strong that trend is falls to ADX.
In the momentum family, four names come up often. RSI plots overbought and oversold zones on a 0–100 scale. MACD tracks the gap between two moving averages against its own signal line. A histogram shows whether that gap is widening. The Stochastic Oscillator measures where price sits within its recent range. The classic Momentum indicator compares today's price with the price some fixed number of periods ago. All four measure the same thing — speed — through their own formulas.
In the volatility family, Bollinger Bands remain the standard tool, developed by John Bollinger in the 1980s. Outside these four families, Fibonacci retracement is worth a mention. It's not an indicator formula at all. It's a way of marking specific ratios along a prior price swing. The goal is to flag levels where price has historically paused.
What Are the Limits of Indicators?
Start from the fact this guide opened with: an indicator is built from data that already happened. The CFA Institute Research Foundation's literature review of technical analysis traces how that shaped the field. As computing power grew, analysts kept building new indicators. "Under quantitative testing," it notes, "many of these indicators have not withstood the test of time or scrutiny of objective analysts". Some, it adds, have been shown to add value. A formula being widely used is not the same as it holding up under testing.
RSI shows this well. In a market with a strong trend, RSI can sit in overbought or oversold territory for a long stretch. Price doesn't have to reverse at all. The reading stays extreme while the trend just continues. Treating one extreme reading as a promise is a common mistake with this indicator. It's a fact to weigh alongside everything else, not a guarantee.
Fitting a period to old data has the same trap built in. A setting can be tuned, after the fact. Whichever value would have worked best on one stretch of history gets picked. Federal Reserve Bank of St. Louis research on technical trading rules found that simple rules on dollar exchange rates delivered real, risk-adjusted returns for roughly fifteen years across the 1970s–80s. Then that edge was "extinguished". A setting that worked once carries no guarantee for next time.
Lag gets worse the faster a market moves. A sharp move over minutes can take a daily indicator days to reflect at all. The same tool on an hourly chart instead gives a different reading. It's built from another slice of history.
Indicators alone are also an incomplete picture. A company's balance sheet or its place in its sector are questions no price-and-volume formula answers. That's the job of fundamental analysis, where a metric like the P/E ratio lives. The CFA Institute review notes that most working analysts combine technical tools with fundamental and macro ones. The industry calls that blend fusion analysis.
There is no such thing as "the best indicator". Each one answers a different question, and each acts its own way depending on conditions. A win-rate percentage attached to an indicator, with no stated source, period, or asset, is a marketing claim. It isn't proof. A real backtest names all three.
Frequently asked questions
Straight answers to what people ask most often about technical indicators.
Does an indicator give a buy or sell signal?
No. An indicator is a number worked out from past price and volume — it does not issue an instruction. Some platforms label a threshold a "signal" for convenience, but that's marketing language, not math. The indicator itself just describes a condition: overbought, low volatility, a strong trend.
Which indicator is the most reliable?
There isn't a single answer. Each family measures a different thing: direction, speed, volatility, or volume. None substitutes for the others. Any claim that one indicator beats the rest isn't proof you can verify. It has to name the exact market, period, and time frame tested.
Can you invest without using any indicators at all?
Yes. Many investors base decisions on a company's earnings or broader macro data instead. That's called fundamental analysis. Indicators are one option, not a requirement.
How many indicators should be used together?
There's no fixed number. Stacking two indicators that measure the same thing twice, two different momentum tools, for instance, adds very little. Pairing indicators from different families tends to build a broader picture. Take one trend tool and one volume tool. That beats a chart full of tools all answering the same question.
Can an indicator's period setting be changed?
Yes, on nearly every platform. A shorter period reacts faster, at the cost of reversing more on noise. A longer one smooths the reading out, at the cost of confirming change later. Which setting fits a trader depends on their own time horizon.
Do indicators work the same way across every asset class?
The formula stays identical, but the reading doesn't always mean the same thing. The same indicator can look far more erratic on a thinly traded stock than on a heavily traded index. Simply put, less volume sits behind each move. Markets that trade around the clock, like crypto, also lack the session close some formulas rely on. That can shift certain readings.
Is anything in this article investment advice?
No. This guide explains what technical indicators are and the groups they fall into. It also covers how they're often worked out and read. It does not tell you which indicator to use or what to do with any reading you see. An investment decision depends on your own goals, risk tolerance, and financial situation. This guide knows none of those.
Sources
iEconomy Academy
This article is a lesson in: Reading a chart · Lesson 3/4
Related News
Candlestick Patterns: Chart Formations and What They Mean
Single, two and three-candle patterns — doji, hammer, bullish engulfing, morning star — with the structure of each, the trend it is looked for in, and an original diagram for every one.

Stock Market Hours and Holidays: NYSE and Nasdaq Guide
A clear reference to regular U.S. stock market hours, pre-market and after-hours trading, early closes, holiday closures, and how bond-market holidays differ.

How to Cash In Savings Bonds: Electronic and Paper
Learn how to redeem U.S. savings bonds through TreasuryDirect or a bank, when penalties apply, how partial redemptions work, and what to do with inherited or lost bonds.
What is Earnings Season and What to Consider in Earnings Reports?
Earnings season is a period each fiscal quarter, usually lasting several weeks, when many of the largest listed companies release their latest
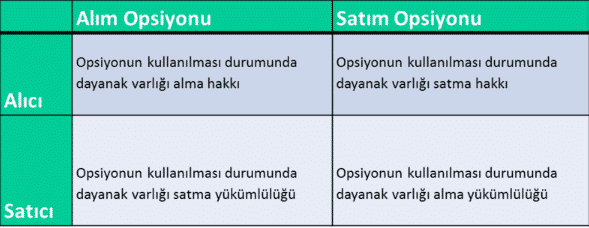
What is Option?
Option contracts are contracts that offer the party who has taken the option the opportunity to buy or sell the product, value or financial asset of a price,
What Is Inflation? CPI, Core Inflation and Purchasing Power
What causes inflation, how CPI and PPI actually measure it, who loses the most, and how central banks use interest rates to fight it.